The Pacific Crest Trail Survey: Seven Years of Data in Review
I’ve been saying I’ll do it for years, and now that we are all locked up thanks to COVID-19, I’ve finally gotten around to it – a comparison of (what is now) seven years’ worth of Pacific Crest Trail hiker data.
If you’re new to the Pacific Crest Trail Hiker Survey, it’s something I began in 2013 after I first hiked the PCT. I thought it would be interesting to collect data from my fellow thru-hikers and then present it on the blog as a resource for future PCT hikers. Since the first year, the PCT survey has grown to encompass a gear guide (along with separate posts for women and couples), resupply guide, hiker breakdown, tales of suffering, and advice for the future.
And even though we’re in the seventh year of the Pacific Crest Trail Survey, this is my first trail doing a comparison of the data across the years, so if there’s something that you don’t see here or something you think would be a helpful/worthy/interesting addition to the post, let me know via comment or email.
JUST SO YOU KNOW: This is not a comprehensive survey of all PCT hikers from each year. Each year I try to reach (and to persuade) as many hikers as possible, but there’s nothing compelling people to fill out this survey. Because of this, the data is not a 100% accurate representation of each year’s PCT class. I’m just a random guy on the internet doing my best to help out PCT hikers.
In This Post

Notes on the data
- I make changes to the survey every year. This includes adding questions, removing questions, and in some cases changing the available responses. Every change I have made is because of something I learned to make the data more useful or something that was suggested/requested by a reader. This means that some data doesn’t translate perfectly across each year (and that not all data is available for each year). That said, I’ve done my best.
- Since it was the first year I conducted the PCT Hiker Survey and since I knew neither what I was doing nor what this would become, I no longer have the raw dataset for the 2013 survey so some data points that are available for subsequent years are not listed for 2013.
- Not everyone one the trail meticulously documents the stats of their thru-hike (I’m weird). Therefore, the data is not going to be 100% accurate. That said, it should be fairly close to the reality of the trail this year.
- In case you need a reminder, the mean is the average and the median is the data point in the middle of the series. If you need any additional explanation, I suggest you consult the Google.
- If there is a data point missing somewhere in a table or on a graph, it’s because there was insufficient data for reporting.
- For any calculation requiring the length of the PCT, I use 2,660 mi / 4,280 km.
- If you’re a real sleuth and you’re going back to each individual survey post and comparing data, you may notice small and occasional discrepancies. This is because I’ve done a more thorough job of cleaning up and sorting the data for the responses. If you need to pick one to go with, use this post.
- If you’re interested in the most up-to-date survey results (for last year’s PCT class), you can find them here: PCT Survey, PCT Gear, PCT Resupply, PCT Demographics, PCT Horror Stories, and PCT Advice.
- If you would like to be notified of the latest posts surveys, click here.
LABELS differentiating hiker segments:
- THRU: Thru-hikers (all)
- THRU-0: Thru-hikers who did NOT complete the PCT
- THRU-1: Thru-hikers who completed the entire PCT
If NO LABEL has been appended to a data point, then I used all data collected (i.e. it also includes section hiker data).
The PCT Demographics
I’m going to work through the data the same way I do in the PCT Surveys – insofar as the data allows.
We’ll begin our journey with something not-so-important to how to prepare for a PCT hiker, but something nonetheless very interesting – the PCT demographics. Over the years, the demographics have remained relatively the same, but there are some gradual and recurring changes in the numbers as well.
PCT Hiker Gender
For each of the past seven years, the majority of PCT hikers have been male. That said, the last three years have seen a lower proportion of male hikers when compared to the previous four.
The increasing popularity of the PCT with female hikers is one of the reasons I’ve also taken to breaking down survey data and compiling a female-specific gear guide.

PCT Hiker Age
Over the course of the past seven years, the average age of PCT hikers has been slowly growing. We can probably treat 2013 as a bit of an outlier since the sample size was significantly smaller than subsequent years, but overall, the majority of hikers are between 25 and 35 years old (after college and before children?).
And in case you didn’t read and respect the notes up at the top instructing you to Google (because I know some of you didn’t) and you can’t quite remember what a median is (because I know some of you don’t), it’s the number that falls in the exact middle if you list all the responses in order (i.e. one-half of all hikers surveyed – who were not the median age – was younger and the other half was older).
In the second graph, we have the distribution of all hiker ages from the previous seven years combined. Mid to late twenties is the dominant force here with a sharp drop off until the mid-forties and then a small bump as we approach the mid sixties.


PCT Hiker Race
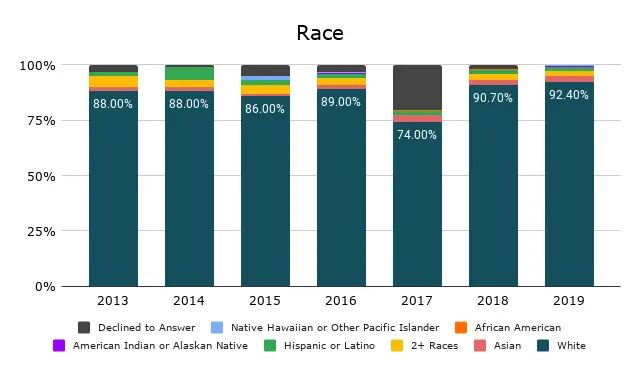
The hikers on the Pacific Crest Trail have been overwhelmingly white across the past seven years. Hikers of two or more races have occupied the second-most-common position for all but one year where 6% of hikers were Hispanic or Latino.
Because of the way I collected and presented the data in 2017, there is a larger percentage of “Declined to Answer” for that year.
PCT Hiker Education
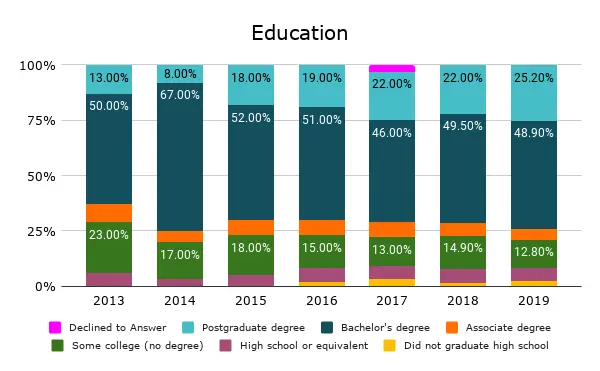
Almost half of PCT hikers each year have had a Bachelor’s Degree. The number of hikers with postgraduate degrees has been slowly growing while those with some college education but no degree (either due to not having graduated yet or dropping out).
Because of the way I collected and presented the data in 2017, there is a larger percentage of “Declined to Answer” for that year.
PCT Hiker Countries
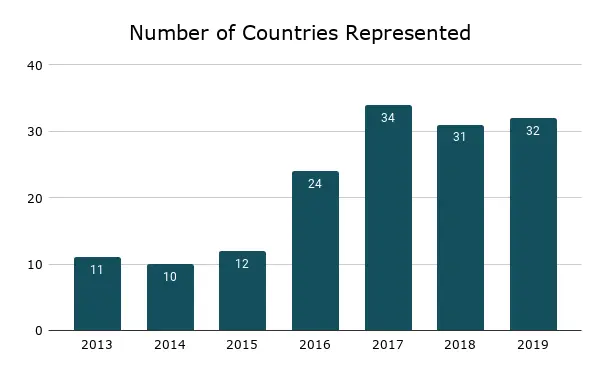
The popularity of the Pacific Crest Trail extends well beyond the borders of the United States.
Over the course of the PCT Survey, the number of countries represented on the trail has grown dramatically. In 2013, there were just 11 countries represented on the trail. In 2019, there were nearly three times as many.
There are only so many “first person from X to have hiked the PCT” spots available in the history books. Best get on it, hikers from most of South America and Africa. If you’re wondering which countries have yet to be represented on the trail, keep reading.
The number of hikers from abroad has been growing. Cumulatively, over the past seven years, 68.7% of survey respondents have been from the United States meaning that nearly a third (31.3%) of thru-hikers (who have taken the survey) have been from overseas.
For the last four years, at least 30% of hikers have been from overseas. This number has been as high as 37.68% in 2017.
Here is every country with at least one person who has completed the PCT Hiker Survey (in alphabetical order).
- Australia, Austria, Belgium, Brazil, Brunei, Bulgaria, Canada, Chile, China, Colombia, Costa Rica, Croatia, Czechia, Denmark, Estonia, Finland, France, Germany, Hong Kong, Hungary, Iceland, India, Ireland, Israel, Italy, Japan, Latvia, Lithuania, Luxembourg, Mexico, Netherlands, New Zealand, Norway, Poland, Portugal, Russia, Samoa, Scotland, Singapore, Slovenia, South Africa, Spain, Sweden, Switzerland, Taiwan, United Kingdom, USA

Note: the chart below shows the distribution of all hikers not from the United States. This is the breakdown of the 31.3% of hikers from international destinations.

Distribution of US-based PCT hikers

PCT representation across the world

The PCT Thru-hiking Basics
This next section delves into some of the actual hiking stats from Pacific Crest Trail hikers. This includes the direction people hiked, whether it was their first long-distance hike, whether they began alone, the number of zero and nearo days taken.
PCT Thru-hiker Direction
Traditionally, northbound has been the direction most people hike the Pacific Crest Trail, but in recent years (due to the trail’s increasing popularity and permit changes) southbound hikes have become more popular.
That said, northbound thru-hikes are still overwhelmingly more common than southbound hikes and have remained the choice of at least 87% of hikers over the years.
The data in this graph is from the PCTA permit data from the past seven years.

First long-distance hike?
The Pacific Crest Trail has been the first long-distance hike for over 2/3 of hikers for each of the past seven years. The number of first-timers each year has been falling each year.
Does this mean that #EXTREMEWALKING is becoming a more popular activity? Or does it simply mean that everyone who has hiked the Appalachian Trail in the past is realizing that they chose the wrong trail to hike first?

Begin hiking alone?
As much as the idea of hiking from Mexico to Canada alone may sound, beginning a PCT hike with another person (or persons) can be a risky decision. Here’s a look at whether hikers began their journeys alone.
In recent years, I’ve expanded this question to clarify exactly whom hikers began with (a partner, friend, or stranger). Last year’s most common response (of those who didn’t begin alone)? Began with a partner/spouse followed closely by “started with a friend”.
Nearly two-thirds of hikers every year of the survey have begun their hikes alone.

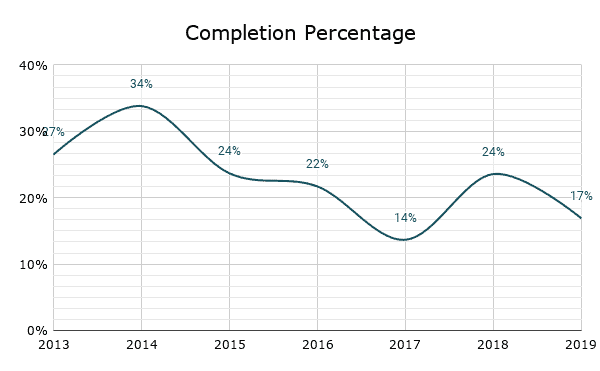
PCT Thru-hiker Completion Percentages
Numbers probably aren’t exact as not everyone who hikes the PCT gets a permit (get a permit, you bag) and not everyone who finished reports their completion to the PCTA, but based on data from the PCTA, here are the thru-hiker completion percentages for the past seven years (based on the number of permits issued and the number of self-reported completions to the PCTA).
The highest completion percentage? Thirty-four percent (34%) in 2014. The lowest? Fourteen percent (14%) in 2017.
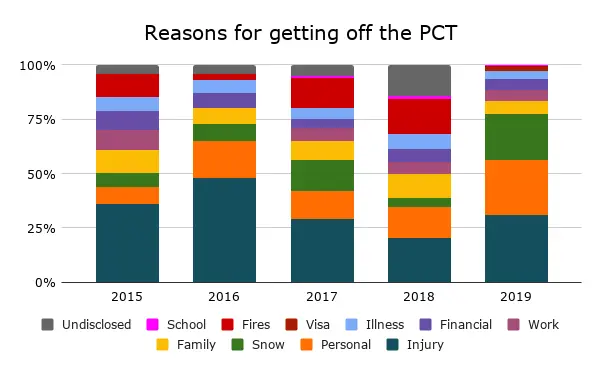
Reasons for getting off the PCT
Nobody begins a thru-hike with the expectation that they’re going to fail in their mission for border-to-border glory. That said, every year, as we saw in the previous graph, the majority of thru-hike permit holders do not complete their hikes.
Here’s a year-by-year breakdown for hikers’ reasons for getting off the trail. Injury was the number one reason for hikers getting off the trail each year. Personal reasons, snow, and fires all occupied the second position for at least one year.
Distance completed before quitting
Above we discussed the reasons for people abandoning their thru-hikes early. Now, we take a look at how far these aspirational hikers made it before calling it quits.
Taking the previous five years into account, hikers make it an average of 1,256 mi / 2,021 km before getting off the PCT.
What’s at mile 1,256? (Not that this being the average means anyone actually gets off the trail here.) Mile 1,256 if in Northern California, just south of Bucks Lake.
The second graph is a distribution of all mileages reached by hikers before getting off the trail. There are spikes between 700 and 800 (the Sierra), 1000 and 1100 (Northern California), and 2000 to 2100 (Northern Oregon).


Saving up money for a thru-hike is an essential part of the PCT planning phase and could easily make or break a hike. Those small-town resupplies can start getting expensive and if you end up getting injured (or hit some terrible weather) and need to take a few days off in a hotel, that extra bit of saving may be crucial.
THRU-1
$6,349
The average amount spent on the entirety of a thru-hike
(σ = $3,355)
THRU-1
$42.55
The average amount spent per day on a thru-hike
(σ = $23.98)
THRU-1
$1,515
The average amount spent on gear prior to starting
(σ = $807)
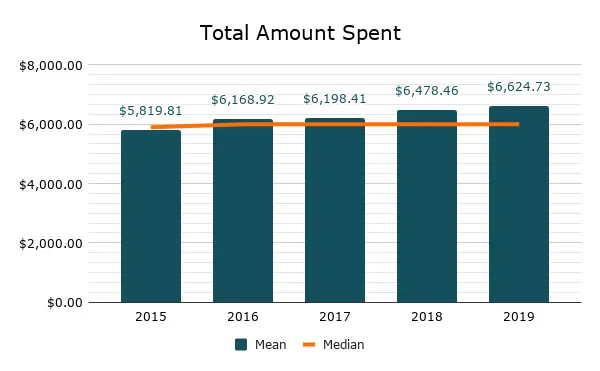
Over the course of the past seven years, the average amount thru-hikers have spent on their hikes has slowly risen every year for the past five years – starting at $5,819.81 in 2015 and increasing to $6,624.73 last year.
That said, the median amount spent each year has remained constant at $6,000 (except for 2015 when it was $5,900).
Basically, to be safe, you should probably expect to spend at least $6,000 on a PCT thru-hike.
The PCT Hiking
So far, we’ve covered a lot of interesting information, but this is a survey about hiking – so we should probably talk about hiking. I already covered some of the numbers below, but the data below reflects the cumulative data instead of individual years. In this section, we cover the length of thru-hikes, zero days, nearo days, longest days of hiking, flip-flopping, and Mount Whitney.
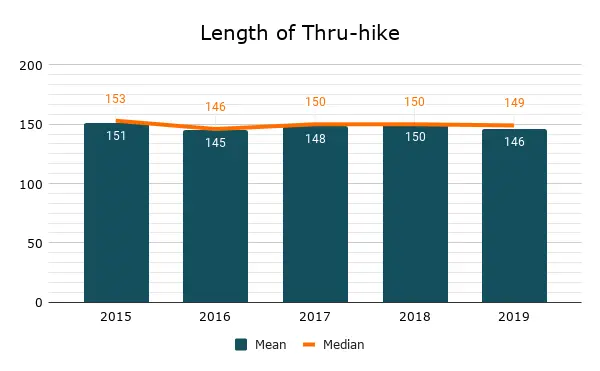
PCT Thru-hike Length
How long is it going to take me to Pacific Crest Trail? Honestly, there is no way for anyone to answer this question for you – please don’t email me and ask. The best I can do is offer you the stats from previous years.
The mean and median for the length of thru-hikers’ time on the PCT hovered around 150 days (i.e. five months) for each of the previous five years.
If you want to explore how long it might take you to hike the Pacific Crest Trail, check out this post (or even explore what a one-month thru-hike looks like).
PCT Zero Days
Zero days (i.e. days hikers spend hiking zero miles and that I typically spend in bed at a local motel) are (usually) an essential part of any thru-hike.
Both the mean and the median number of zero days taken by thru-hikers on the PCT over the past seven years has been between 15 and 20. Basically, if you hike the PCT you can expect to take between two and three weeks off from hiking (you lazy piece of shit).

PCT Nearo Days
Nearo days (i.e. days hikers hike only a small number of miles – usually into or out of town) are also a fact of life on the trail during a thru-hike.
The mean and median number of nearo days were almost identical across the course of the past seven years (reported by thru-hikers), so basically, you can expect to have 15 nearo days during your hike (probably those days when you decide late in the afternoon that you’re going to hike out and not take a zero).

Longest Day of Hiking
It’s not the most important thing to many hikers, but if for nothing more than personal reasons, I’m sure that any thru-hiker will be able to tell you what their longest day of hiking has been.
The longest day thru-hikers have averaged over the past seven years is 38.86 mi / 62.54 km. If you’re never thru-hiked before then this number might look incredibly intimidating and perhaps even impossible to you. But I invite you to revisit this sentiment when you’re crossing the California-Oregon border.

THRU-1
149.19
The average number of days of an entire thru-hike
(σ = 22.74)
THRU-1
132.13
The average number of days hiking (total minus zero days)
(σ = 19.18)
THRU-1
38.86 mi
The average longest day (62.54 km)
(σ = 8.59 mi / 13.82 km)
THRU-1
20.56 mi
The average daily mileage (33.09 km)
(σ = 3.28 mi / 5.28 km)
THRU-1
17.97
The average number of zero days
(σ = 13)
THRU-1
15.26
The average number or near-o days
(σ = 9.19)
Flip-flopping on the PCT
Flip-flopping (or simply flipping) is the act of jumping ahead to somewhere on the PCT with the intention of then hiking south to the spot where you initially left the trail. Alternatively, hikers can just continue hiking the direction they were initially and then return to where they left the trail and make up the miles once the obstacle responsible for the flip is no longer an issue.
You’ll notice that in 2017 and 2019 a larger percentage of hikers flip-flopped due to these years being higher snow years (the Sierra is a common place for hikers to flip).
That said, the PCTA has recently revised permit rules making flip-flopping a highly undesirable move (it should have never been desirable in the first place).

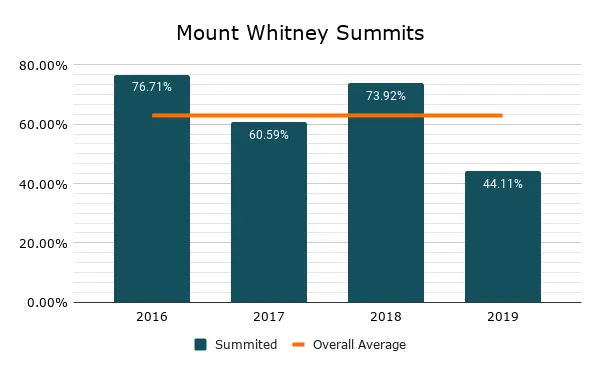
Mount Whitney Detour
For those who don’t know, the Pacific Crest Trail passes just west of Mount Whitney (the highest peak in the Continental United States at 14,505 ft / 4,421 m) in the Southern Sierra. The 16-mi / 32-km round trip journey to the summit may seem like a no-brainer, but things are a bit more complicated on the trail. Here’s a look at how many hikers have been summitting over the past four years.
At most, nearly 77% of hikers summited Whitney in 2016. In 2019 just 44% made it up to the summit.
The PCT Resupply
Besides the actual hiking part, Pacific Crest Trail resupply is perhaps the most important part of thru-hiking. Where will you get food (i.e. sugar and carbs)? Where will you wash your socks? Where will you take an entire day to catch up on your favorite series and eat junk food? All important questions in the PCT resupply equation.
Here we look at the number of resupply stops hikers take, what their resupply box mailing strategies are, how many resupply boxes they send, the number of days/miles between resupplies,
Resupply Stops
The number of resupply stops hikers average over the years has been as low as 22 (however, this was in 2013 when we didn’t have the greatest dataset) and as high as 28.
The average number of resupply stops across the previous seven years? 27.23.
This means that, on average, hikers will go 97.69 mi / 157.22 km between resupplies. Combine this with our average distance per day of 20.56 mi / 33.09 km and we can expect that hikers will take approximately 4.75 days between their resupplies.

THRU-1
27.23
The average number of resupplies over the entire trail
(σ = 6.9)
THRU-1
4.75
The average number of days between resupplies
(σ = 1.4)
THRU
97.69 mi
The average number or miles between resupplies
(157.22 km)
Resupply Box Strategy
Depending on how much preparation you want to do for your PCT hike (and how restrictive your diet is), you may spend a lot of time packing resupply boxes prior to setting out on your journey.
Every year, most hikers will send at least some resupply boxes – usually three-fourths or more – but every year there are also hikers who choose to send all their boxes (although this number has been falling) and hikers who choose to send no boxes (but for some reason this number dropped dramatically last year).

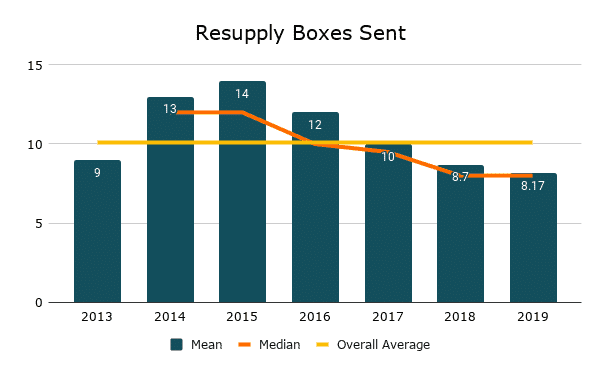
Number of Resupply Boxes
So the vast majority of hikers send themselves at least some resupply boxes – but how many?
On average, thru-hikers who completed the trail, sent themselves 10.1 resupply boxes. This works out. This number increased from 2013 until 2015 when it peaked at 14. Since then, the number of resupply boxes hikers have been sending themselves has been slowly decreasing. Possibly due to trail towns becoming more aware of hikers and better prepared to take their resupply dollars?
Pre-departure Resupply Boxes
What many first-time thru-hikers fail to realize (or accept) is that you can send yourself resupply boxes from on the trail. That said, there are a number of reasons why you would want to prepare yourself resupply boxes ahead of time (to be sent out by yourself before you leave or by someone else who cares dearly about your success on the PCT).
A couple years ago I began asking thru-hikers how many resupply boxes they prepared prior to setting out on the PCT.
On average, hikers prepped 4.24 boxes before setting out.

THRU-1
10.1
The average number of resupply boxes sent over the entire trail
(σ = 7.2)
THRU
4.24
The average number or pre-trail resupply boxes prepared
(σ = 5.7)
Knowing how many resupply boxes you’re going to be sending is only half the battle. You’re also going to need to know where to send those boxes.
I ask PCT hikers where, if anywhere, they would definitely suggest sending a resupply box and the answers have remained relatively consistent over the years. Since the average number of resupply boxes sent by thru-hikers over the years is 10.1, I’ve included the top ten resupply locations where hikers suggest mailing a resupply box.
You’ll notice Washington is heavily favored as a place to send resupply boxes. The locations in each section appearing in the table are:
- The Desert: Warner Springs and Agua Dulce
- The Sierra: Kennedy Meadows (nor to be confused with Kennedy Meadows North in Northern California)
- Northern California: Sierra City and Belden
- Oregon: Crater Lake (Mazama), Timberline Lodge, Shelter Cove, Big Lake Youth Camp
- Washington: Trout Lake, White Pass, Snoqualmie Pass, Stevens Pass/Skykomish, and Stehekin
| First | Second | Third | Fourth | Fifth | Sixth | Seventh | Eighth | Ninth | Tenth | |
|---|---|---|---|---|---|---|---|---|---|---|
| 2013 | Kennedy Meadows (Sierra) | Stehekin, WA | Stevens Pass/Skykomish, WA | Crater Lake (Mazama), OR | White Pass, WA | Snoqualmie Pass, WA | Warner Springs (Desert) | Shelter Cove, OR | Timberline Lodge, OR | Belden (NorCal) |
| 2014 | Kennedy Meadows (Sierra) | Stehekin, WA | Warner Springs (Desert) | Snoqualmie Pass, WA | Stevens Pass/Skykomish, WA | White Pass, WA | Timberline Lodge, OR | Vermilion Valley Resort (Sierra) | ||
| 2015 | Kennedy Meadows (Sierra) | Stehekin, WA | Stevens Pass/Skykomish, WA | White Pass, WA | Sierra City (NorCal) | Snoqualmie Pass, WA | Belden (NorCal) | Warner Springs (Desert) | Crater Lake (Mazama), OR | Trout Lake, WA |
| 2016 | Stehekin, WA | Kennedy Meadows (Sierra) | Stevens Pass/Skykomish, WA | White Pass, WA | Snoqualmie Pass, WA | Warner Springs (Desert) | Trout Lake, WA | Crater Lake (Mazama), OR | Big Lake Youth Camp, OR | Shelter Cove, OR |
| 2017 | Stehekin, WA | Kennedy Meadows (Sierra) | Stevens Pass/Skykomish, WA | Snoqualmie Pass, WA | White Pass, WA | Crater Lake (Mazama), OR | Warner Springs (Desert) | Trout Lake, WA | Sierra City (NorCal) | Shelter Cove, OR |
| 2018 | Stehekin, WA | Kennedy Meadows (Sierra) | Stevens Pass/Skykomish, WA | Sierra City (NorCal) | Big Lake Youth Camp, OR | Warner Springs (Desert) | Crater Lake (Mazama), OR | Mazama, WA | Timberline Lodge, OR | Snoqualmie Pass, WA |
| 2019 | Stehekin, WA | Crater Lake (Mazama), OR | Sierra City (NorCal) | Stevens Pass/Skykomish, WA | White Pass, WA | Snoqualmie Pass, WA | Kennedy Meadows (Sierra) | Big Lake Youth Camp, OR | Agua Dulce (Desert) | Warner Springs (Desert) |
It’s worth mentioning that every year I asked hikers where they would have preferred to send a box instead of buying food locally, Sierra City (in Northern California) was the overwhelming response.
Not all resupply stops are created equal and every year I ask hikers which places were their favorite and least favorite to stop at along the PCT.
Note: This question specifies that “Favorite/Least Favorite” means which places hikers most/least enjoyed and not which locations had the best/worst resupply options (although these could be the same).
Favorite Resupply Stops
| Desert | Sierra | NorCal | Oregon | Washington | |
|---|---|---|---|---|---|
| 2016 | Idyllwild | Bishop | South Lake Tahoe | Ashland | Stehekin |
| 2017 | Idyllwild | Bishop | Etna | Ashland | Stehekin |
| 2018 | Idyllwild | Bishop | South Lake Tahoe | Ashland | Stehekin |
| 2019 | Idyllwild | Bishop | Etna | Ashland | Stehekin |
Least Favorite Resupply Stops
| Desert | Sierra | NorCal | Oregon | Washington | |
|---|---|---|---|---|---|
| 2016 | Hikertown | Kennedy Meadows | Belden | Shelter Cove | Snoqualmie Pass |
| 2017 | Hikertown | Kennedy Meadows | Sierra City | ||
| 2018 | Hikertown | Vermillion Valley Resort | Sierra City | ||
| 2019 | Hikertown | Kennedy Meadows | Belden | Crater Lake National Park | Stehekin |
For more on Pacific Crest Trail Resupply, check out the latest PCT Resupply Guide or these PCT Resupply posts.
The PCT Gear
Want to talk about gears for what could literally be hours? Just get yourself into a room with a group of Pacific Crest Trail hikers and enjoy the show.
It’s a common misconception that there exists some perfect gear list that will ensure your success on the PCT, but this is simply not true. The truth of it is that the right gear can make things easier (or harder), but it’s not going to make or break your hike (but actually, it could if you die of hypothermia after venturing out into a storm ill-prepared).
Here’s a breakdown of what’s been going on in Pacific Crest Trail world for the last seven years.
Hiker Base Weights
THRU
18.43 lbs
Average pre-hike base weight (8.36 kg)
(σ = 8.32 lbs / 3.77 kg)
THRU-1
15.07 lbs
Average post-hike base weight (6.836 kg)
(σ = 5.34 lbs / 2.42 kg)
THRU(-1)
-3.36 lbs
Average total change in base weight (912 g)
(σ = 6.21 lbs / 2.82 kg)


THRU
55.76 L
Average backpack size
THRU
17.48°F
Average sleeping bag rating (-8.07°C)
THRU-1
3.90
Average total number of shoes used
Highest-rated Backpacks


Highest-rated Shelters


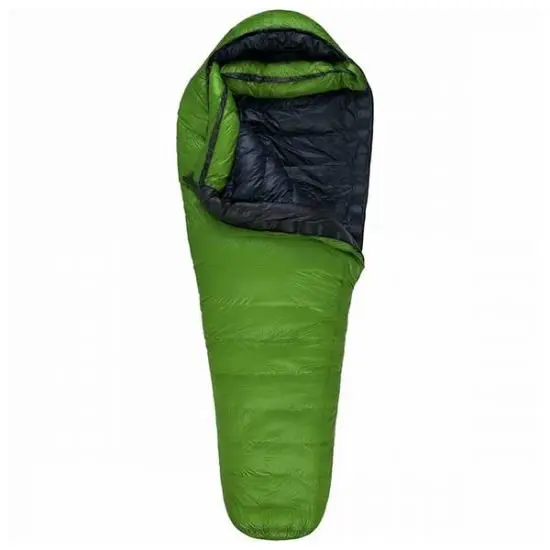
Highest-rated Sleeping Bags

For more on PCT gear, check out the Pacific Crest Trail Survey Gear Guide.
Pacific Crest Trail Survey Collection
And that’s all I’ve got for you now. This is my first time doing one of these comparison posts, so if there’s something you would like to see improved upon, added, subtracted, or otherwise modified, please COMMENT BELOW or get in touch to let me know.
If I can find a way to make it interesting and valuable, I might do a similar follow-up post but in the vein of the PCT Gear Guide and the PCT Resupply Guide.
Thanks to everyone who has participated in the survey over the years. You’re all amazing people.
Affiliate Disclosure: This page may contain affiliate links, which means I may receive small commissions for purchases made via these links at no additional cost to you. This helps pay the bills and keep the site up and running. Thank you for your support!


Just out of curiosity, how large is the average sample size that you’re pulling data from?
It varies depending on the year. The smallest year was just over 100 respondents and the largest was nearly 900.
I really admire the amount of work you put into this…thanks for continuing to do it.
Thank you!
Looks great! I have looked at it every year, nice to see a comparison. Statistically speaking it would be good if you could always have the number of observations ready – how many people have answered certain questions in certain years. For the lines e.g. thru hiker completion percentage, I am guessing you used a smoothing method. Looks nice, but if there is only a single data point e.g. 55%, you best use a normal line tool, which will give you a zigzag, but is the more accurate version. Thanks a lot for your effort, it’s great to have a data pool :)
This is a good point, maybe just a bar graph would be better for completion percentages since they aren’t really on a spectrum.
Great job Thanks for sharing and doing all this work
You got it! Thanks for sharing ;)
On mobile, several of the graphs are cut off and can’t be fully seen. It’s a bit better on desktop, but even there, you can’t fully see a bunch of the graphs. For example, on the base weight graphs, I can only see up to 2017, and for the Whitney summits and flip-flop graphs, 2019 can’t be seen (those aren’t the only ones).
Otherwise, this is really cool to see the differences between years! Thanks
Maybe ignore this. I reopened the page on mobile and the it looks quite different and now I can scroll all the images to see them fully. Not sure what happened before (I had tried several times).
Yeah, this should be resolved now. Thank you for pointing it out!
Amazing piece of work! I remember when you started. Wow. I think it’s well done in terms of your statistics and clearly summarized, with humor. Your real skill may ultimately turn out to be analysis-driven writing or just writing. That you even wanted to do this, and the homework required, is an indicator. I enjoyed every bit of it.
Happy to hear it, Jane!
Flip flops seem like a great way to reduce stress and deal with permit limits.
Is there something wrong with starting in Oregon, going north and then flipping and heading south?
Or have I misunderstood your comment about flip flops?
Flip flopping can be a unique way to explore a trail, but you lose out on the true “thru-hiker experience” by hiking a trail this way.