
The 2020 Pacific Crest Trail Hiker Survey – Part I: NOGO
This late into the year, I’m sure we’ve all been reminded plenty that 2020 is/was, to say the least, different. The 2020 Pacific Crest Trail thru-hiking season was no exception.
I considered not conducting a survey this year as I didn’t want to encourage getting on the trail. But since I don’t promote/conduct the survey until the end of the hiking season (and since I doubt anyone is hiking across the Western United States for the express purpose of filling out an online survey), I decided to go ahead with it.
The fact is that there are people who thru-hiked the PCT this year (albeit far fewer than had plans to at the start of the year), and information from this year’s class could still prove useful to future hikers of the PCT. And the information from those who chose to cancel their hikes could prove just as helpful.
That said, I am not publishing these survey posts to glorify or legitimize the decision to thru-hike during a pandemic. In case you missed them, I wrote not one, but two posts in March telling hikers to stay off the trail this year. In fact, a small contingency of 2020 crybabies (who are unjustifiably distressed and upset at the Pacific Crest Trail Association for not recognizing their 2020 thru-hikes) chose to boycott the survey because of my having advised hikers to stay off the trail.
CLARIFICATION: the crybaby statement above has spawned many hate-filled messages and I wanted to clarify whom I am addressing here. When I submitted the survey to various PCT Facebook groups requesting that hikers fill it out, I received a slew of hateful messages and comments by hikers bitter about me having posted the two aforementioned posts regarding canceling thru-hikes. I am not calling the entire class of 2020 crybabies – just those hateful crybabies who were angry at my gall for conducting a survey after my COVID-related posts. If someone can’t understand why I posted those articles, then I don’t know how they expect people to understand their decision to thru-hike. Hopefully, this helps – or maybe it will just make people angrier. *shrugging emoji goes here*
This is why the first installment of the PCT Survey this year won’t be the usual breakdown (this will come next) but will instead focus on those hikers who made the difficult decision to cancel their hikes. The NOGO hikers. Get it?!
The PCT Survey exists to help people prepare for their hikes and I hope to make this year’s survey as helpful as possible to future PCT hikers. I can’t promise it will be as comprehensive as previous years, but I can promise it will (likely) be more helpful than your local REI employee (nothing against REI employees, but…yeah).
At the least, this year’s survey has afforded me the chance to refine the survey’s format, questions, and responses to better report on and share data from future PCT classes.
Notes on the data
- This year we had 460 completed surveys – a 45% decrease vs. last year
- Not all PCT hikers meticulously document the stats of their thru-hike (yes, I’m weird). Therefore, the data is not going to be 100% accurate.
- I refer to survey respondents collectively as this year’s “class“. Remember, this is a sample and not a comprehensive survey of every single PCT hiker who intended to hike or who did hike the PCT this year.
- If they don’t currently recall anything more than math-exam anxiety, it’s suggested you familiarize yourself with the words average, median, and standard deviation (σ).
- I will be releasing more detailed posts focused on PCT Hikers (Who Hiked), PCT Hikers Who Hiked vs. Those Who Canceled, PCT Gear, PCT Resupply, PCT Demographics, PCT Horror Stories, and PCT Advice in the coming weeks. If you would like to be notified of new surveys, click here.
Demographics
In this section, I am including all data collected from all hikers – those who hiked and those who canceled their hikes. I will be publishing separately a breakdown of the hikers who were actually on the trail and a comparison of how these hikers compare to those who canceled their hikes.
Here are this year’s hiker demographics.
PCT Hiker Gender
- 58.7% Male
- 40.4% Female
- 0.7% Non-Binary
- 0.2% Genderqueer

PCT Hiker Age
- < 20 | 0.93%
- 20-24 | 9.49%
- 25-29 | 24.54%
- 30-34 | 19.44%
- 35-39 | 8.80%
- 40-49 | 9.95%
- 50-59 | 12.96%
- 60-69 |11.34%
- > 70 | 2.55%
Average age: 39
Median age: 33
σ: 14

PCT Hiker Race
- 91.7% White
- 3% Asian
- 2.8% Two or More Races
- 1.4% Hispanic or Latino
- 0.2% Native Hawaiian or Other Pacific Islander
- 0.9% Decline to answer

PCT Hiker Education
- 52.6% Bachelor’s degree
- 11.1% Some college (no degree)
- 7.3% Master’s degree
- 6.4% MBA
- 6.4% Associate Degree
- 5.2% PhD
- 4.5% Graduated high school or equivalent
- 1.2% JD
- 0.9% 12th grade or less
- 0.5% DDS

Where Hikers Are From
Pacific Crest Trail hikers may be mostly white, educated, twenty/thirty-somethings, but they are certainly more diverse when it comes to where they hail from. Every year, people come from all over the country and the world to hike the PCT. Here’s a look at where hikers were from (or would have been from) this year.
- Argentina, Australia, Austria, Belgium, Brazil, Canada, China, Czechia, Denmark, Finland, France, Germany, Italy, Japan, Luxembourg, Mexico, Netherlands, New Zealand, Norway, Scotland, Slovakia, Slovenia, South Africa, Sweden, Switzerland, Taiwan, United Kingdom, United States (28 TOTAL)
A look at the distribution across the world – we’ve got representation from every continent (sorry, Antarctica, you don’t count as a continent for PCT Survey purposes).

Since the USA dominates the world distribution, here’s a closer look at where hikers come from across the Atlantic in Europe (the second-most represented continent).

PCT Hiker US States & Territories
- AK, AZ, CA, CO, DC, FL, GA, HI, ID, IL, IN, MA, MD, ME, MI, MN, MO, MS, MT, NE, NH, NJ, NY, NC, OH, OK, OR, PA, SC, TN, TX, UT, VA, WA, WV, WI, WY (37 TOTAL)

MOST-REPRESENTED COUNTRIES
- USA – 67.1%
- Germany – 6.2%
- Canada – 4.3%
- United Kingdom – 3.6%
- Australia – 3.3%
- Switzerland – 2.4%
MOST-REPRESENTED US STATES/TERRITORIES
- California – 27.6%
- Washington – 12.5%
- Oregon – 9%
- Texas 5.4%
- Colorado – 5%
- Florida – 3.6%
Hiker Jobs & Working Conditions
How are you able to take so much time off to hike for five months across the United States? Probably a question that anyone planning a Pacific Crest Trail hike has been asked at some point or another.
This year, I asked hikers what they do for work (when they’re not being incredible hiking machines) and how they were able to take time off to hike the PCT.
Hiker Jobs
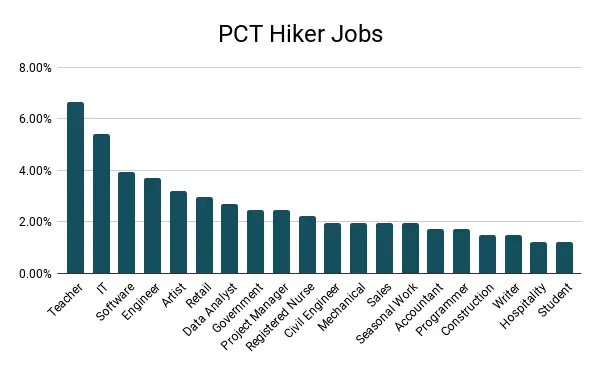
This year, hikers reported 135 different professions. The most common of which were:
- 6.65% Teacher
- 5.42% IT
- 3.94% Software Engineer
- 3.69% Engineer
- 3.20% Artist
- 2.96% Retail
- 2.71% Data Analyst
- 2.46% Government
- 2.46% Project Manager
- 2.22% Registered Nurse
That said, 12.81% (larger than any single profession) reported being retired. More on this in the next section.
Hiker Working Conditions
So how was this year’s class able to (or how would they have been able to) take all that time off and hike the PCT?
- 19.24% Between jobs
- 15.91% Retired
- 13.78% Flexible work conditions
- 12.59% Unemployed
- 11.64% Unpaid time off
- 9.5% Sabbatical
- 4.51% Gap year
- 3.56% Negotiated into employment
- 3.56% Seasonal worker
- 3.56% Student
- 2.14% Quit job

I’ve realized that there exists some ambiguity regarding the choices of “between jobs” and “unemployed” as they are essentially the same thing. Next year, I may qualify “between jobs” to mean that you have a job already lined up for when you complete the PCT.
I will also try to make sure that the “quit job” option is properly added to each of these options.
Hiker Experience
Many of the survey respondents this year didn’t hike the PCT, but that doesn’t mean they weren’t planning their hikes for some time before COVID-19 shut the world down.
Here’s a look at what the 2020 class looked like during their “Planning a PCT Hike” phase. This section examines first-time hikers, hiker experience level, and other trails hiked.
First long-distance hike?
Instead of asking respondents whether this would be/was their first long-distance hike, I asked the distance of their longest hike to date (pre-PCT) – more on the specifics of this below. I decided to use 100 mi / 160 km as the cutoff for being considered to have completed a long-distance hike (sorry, Wonderland Trail hikers). If you want to yell at me for the arbitrary number I chose here (or suggest a better one), feel free to yell at me in the comments below.
First Time Hikers
- 48.8% Yes
- 51.2% No
Average longest trail hiked: 418
Median: 100
These numbers are a lot closer to even than last year when 68% of hikers were on their first long-distance hike and 32% had previous long-distance experience.

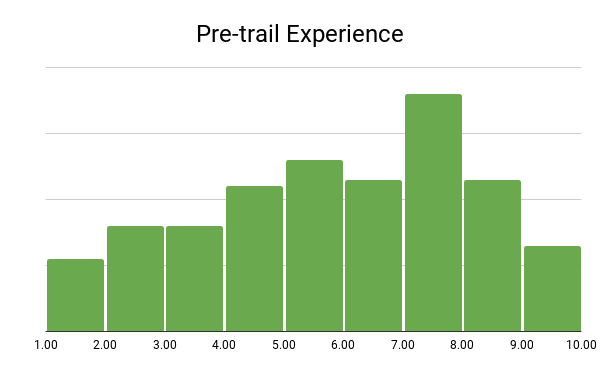
Hiker Experience Level
In addition to asking the longest trail completed by hikers pre-PCT, I ask respondents to evaluate their level of backpacking experience on a scale of 1 to 10.
Note: this is their level of experience prior to beginning the PCT.
Average experience: 6.02
Median experience: 6
σ: 2.65
Previous Trails Hiked
The trails most commonly hiked by those with experience were:
- 11.28% PCT Section Hike
- 8.85% John Muir Trail
- 7.74% Appalachian Trail
- 5.75% Appalachian Trail Section Hike
- 3.76% Camino de Santiago
- 3.54% Tahoe Rim Trail
- 2.88% Colorado Trail
- 2.43% Pacific Crest Trail
- 2.21% Kungsleden
- 1.55% Long Trail
- 1.33% Arizona Trail
- 1.11% Continental Divide Trail
- 10.4% Other Trail

The most common trail this year’s Pacific Crest Trail Class had experience with were the PCT section hikes and the John Muir Trail. I guess after getting a taste, hikers decided they’re ready for the whole thing.
Pre-hike Training
Next, we’ll look at whether this year’s class trained in preparation for their thru-hikes, what they did to train, and how they rated their fitness (pre-PCT).
Did you train before your hike?
- 79% Yes
- 21% No

What did you do to train?
- 61.95% Day Hikes
- 34.07% Multi-day hikes
- 33.63% Running
- 30.97% Weight Training
- 12.39% Step Machine
- 5.75% Other
“Other” mostly consisted of “walking” and/or some sort of bicycle riding.

Pre-trail Fitness Level
I asked hikers to rate their level of fitness (on a scale of 0 to 10) prior to beginning the trail.
Average fitness: 6.06
Median fitness: 6
σ: 1.6

Money Spent on Gear
The question of how much money is required for a thru-hike is one that gets asked by a lot of would-be PCT thru-hikers each year. Sure, I may have written a post on the subject, but there’s nothing better than hoards of hiker data.
Since in this post we’re only examining questions able to be answered by hikers who canceled their hikes, I’m only including the pre-trail gear spend here (that is, the amount spent on gear before beginning the PCT). I’ll be covering the cost of the PCT by those who hiked this year in a subsequent post.
Amount Spent on Gear
Average spend: $1,613.90
Median spend: $1,500
σ: 1,231.28

PCT Permits
A lot of Pacific Crest Trail permits were de facto invalidated this year by the stay-at-home orders issued and the fact that they require hikers to begin their hikes on their permitted day. But we can still look at whether people obtained permits and how they fared in getting a permit for their desired start date. Of this year’s respondents, 98.61% obtained a PCT permit from the PCTA.
Did you receive a permit for the start day you wanted?
Permits for the PCT are (generally) issued in two phases and require that you be online at a designated time as hikers are randomly allowed to request permit start dates. I asked this year’s class whether they got a permit for the date they wanted and whether they were happy with their permit’s date.
- 64% Yes (received a permit for date requested)
- 13% No, but still happy with permit date
- 8.6% Yes, received a permit for +/- 5 days of requested date
- 5.3% Yes, received a permit for +/- 3 days of requested date
- 2.6% Yes, received a permit for +/- 1 day of requested date
- 6.5% No (not happy with permit date)

Future PCT Plans
Lastly, I asked all the hikers who canceled their Pacific Crest Trail hikes this year, whether they intend to hike the PCT at some point in the future. Not being able to hike the PCT isn’t like not being able to get reservations at some restaurant while you’re on vacation. You’ll forget about that restaurant. You won’t forget about the PCT.
Here’s what this year’s class hopes. to do regarding their PCT hikes in the future.
Do you plan on hiking the PCT in the future?
- 49.8% Yes, 2021
- 15.4% Yes, 2022
- 0.7% Yes, 2023
- 0.4% Yes, 2024
- 29.8% Yes, one day
- 1.1% Maybe
- 2.8% No
The PCTA has already forgone issuing their first round of permits for the 2021 hiking season. We’ll see what happens next year as far as permits go, but 2021 (or 2022) could be a very competitive season for PCT permits.

Support the Survey
Every year, I get a lot of people asking how to support the surveys. Beyond sharing them with your close-knit bubble of weird hiker friends, the best way to support the survey is to contribute via Patreon. You’ll get access to exclusive posts, discount codes, live streams, and super, extra cool stickers so that everyone will know how cool you are.
If you’re not into Patreon, that’s cool; you can Venmo @halfwayanywhere, Cash app $halfwayanywhere, or PayPal moc.erehwynayawflah@tcatnoc
This is not expected. The data collected in the survey will always be free and accessible to everyone who wants/needs it. Your support is much appreciated and helps pay the website (and survey) bills.


Changes for Next Year
Every year I ask both the survey respondents and you the reader for feedback on the survey and what you would like to see done to improve the data or to make it more useful for future hikers. If you have any feedback, I would love to hear it – leave a comment below to let me know.
Pacific Crest Trail Survey Collection
Finally, another HUGE THANK YOU to all the hikers, whether or not you hiked the trail, who completed this year’s survey, including (but not limited to): “Brock”, A.C.A.B., Aardvark, AB, Amy, Bare Foot, Bass, Berserker, Big Easy, Big Rig, Bilbo, Bird, Blarney, Braveheart, Breezy, Buffy, Buffy the Mosquito Slayer, BURNING MAN, CANNON BALL, CBS, Chairman, Chant, Cheesehead, Chicken Wing, Chinook, Chipmunk, CIA, Circus, Corax, Coucous with Tears, Crosscut, Cub, Dallas, Danger, Dante, Donuts, Dr. Manhattan, EasyBake, English Girl, Ez, Falcon, Ferrari, Firebird, Foti, Fridge, Frog, frosty, Gift Horse, Gilly, Grey Fox, Ground Score, GT, Hairy Potter (Dirty), Happy, Helo, Hopper, Hoss, Hot Cheeks, Huckleberry, Hulk, Iceman, Icky, Igor, int(r)o_vert, Javelin, Jenga, Jeopardy, John Goodman, karen, Kayo, King Pin, Kitchen Sink, Lambchop, Lazy Bones, Lego, Lima, Lincoln Logs (aka Linc), littlefrenchman, Lobster, LUCKY, LumberJill, Macgyver, Machine, MaconTracks, Mad Scientist, Majci, Marmalade, Masochist, Mayo, Maz, Missoula, mj, Mom, Motorcycle Mama, Mr. Scott, Nap, Naps, Newt, Ol’ Mac, Otter, Pa, panic noodles, Panzer, Paps, Peabody, Pefak, Picasso, Pie, Pig Pen, M.D., Pilgrim, Pitstop, Pittsburgh, Play Doh, Pocketsauce, Pointless Up and Downs (PUD), Polar Bear, poppins, Pritch, Professor, Quill, Radar, Radish, Ranger, Ranger Gary, Raptorman, Reboot, REV, Reverb, Road Warrior, Rockhound, Rongway, Rudolph, sadspot, Salad Fingers, Salt, Sandals, Sauce, Scout, Scribe, Sherwood, Silver Lining, Six-Pack, Skai, Skipper, Skippy, SkyTree, SkyTree, Sleeping Beauty, Slice, Slog, Smiley, Snaphappy, Snapshot, Snatchy Becky, Snow Bunny, Sonic, Sparkles, Speaker, Speed Racer, SpiderGirl, Spotter, squeek, Steely Dan, Stitch, Stumbler, Stumblina, Sturdy Peasant, Survivor, Taco Raptor, Terminator, The Cobbler, The Dude, The Motor, The Surfer, Theory, Thorny, Thursday, Tiger Cub, Tinker, Toe, Truck, Tunes, Turner, Two Braids, Vegemite, Weasel, WILDCAT, Windmill, Wingfoot, Wiseman, wishingbone, Wit, Woody, Wungus, Yardsale, Zen, Zero (Fucks), Zero Chill, and Zipper
It takes a long time to put this together each year and I would love your feedback. Please COMMENT BELOW or get in touch to tell me what you think about this year’s survey or what you think will improve future surveys!


I like your column it sets apart the doors and don’ts
I’m not sure what you’re referring to.
Mac you know I’ve been a long-time supporter of your surveys. The amount of ads on this post are disruptive. Too many and too active slowing down my ability to scroll. Very distractive (which I know is the point) but really irritating. It took away from me processing the info. I counted 22 ads!
Hey Jan – appreciate the feedback. Are you on desktop or mobile?
No ads on desktop.
So let me get this straight: You call people crybabies and then they complain that you call them crybabies. Aren’t they proving your point? Can’t we all just get along?! LOL
Anyway, thank you so much for putting this information together – nice job and keep up the good work!
It’s sad that these people will be the ones the rest of us associate with the PCT Class of 2020.
I think your service is invaluable for trail prep. You do good things here. Generally. But calling us “crybabies” is unnecessary. We worked hard to complete the trail (or the sections for those who did) this year. I went longer stretches without town visits just to “stay away.” But I wouldn’t change it. I would have had to be in public more if I was still at home during all of this. We always wore masks in town and even on trail. We had rangers ask for our permits and they quickly said, “Okay, good to go. Thanks.” So not useless. Saw a lot of people out for weekend adventures on crowded trails – are they bad people? Should we call them names? Maybe keep the name calling out of it, no?
I clarified the crybaby statement above. I did not mean to call the entire Class of 2020 crybabies. If you don’t like my clarification, then I fear we may not see eye to eye on this. Let me know.
I’ve been vocal about how I feel regarding the treatment of PCT 2020 thru-hikers by the PCTA and other online sources. Truth is, we had towns that were so excited to see us roll in that they drove up to greet us and encouraged us to shop and stay. We wore masks, often they didn’t. I did not go into towns often, especially at the very beginning (do you know how heavy a 270 mile resupply is?). I do not think you clarified much, as you are still calling people names. I’m sorry, Mac. I’ve lost a lot of respect for you. But you do a good service for others. Thanks for that.
Sorry to hear you feel that way.
The PCTA did not invalidate 2020 permits, they simply stopped issuing any available dates. All 2020 PCT permits that were issued and printed were indeed valid.
Made the correction. Permits were not invalidated. PCTA didn’t need to do that since travel through National Forests and National Parks was prohibited. Not invalidated, but essentially useless.
No National Forest prohibited foot travel due to COVID. And when Yosemite re-opened in June (before the hiker bubble usually arrives) it was initially ONLY open to valid permit holders.
California: stay at home order issued March 19 (link)
Oregon: bans camping in state parks and forests (link)
Washington: Stay at home order issued March 24 (link)
A PCT permit does not give hikers the right to violate any of these.
Stay at home orders and park closures ended in May and June. In Oregon and Washington, they did not overlap with thru hiking season at all. Hikers who started after stay at home orders ended violated no state or federal regulations by hiking. I suspect that if surveyed they would not call their permit “useless”.
The PCTA *says* they are not recognizing 2020 thru hikes and yet on the very same page they list the names of 17 hikers that completed a 2020 thru-hike. It’s either hypocrisy or they simply changed their minds and forgot to edit the statement. But then why only 17 names? Could it be that 17 people completed the PCT in 2020 BEFORE COVID happened?
Sounds like a question for the PCTA. Possibly people who were section hiking and finished their final sections in 2020?
Well that was one of the reasons!
Can’t wait for the rest of the survey!
I mean, who doesn’t love filling out a good survey?
Mac: First of all, thank you. I used your earlier CDT survey results a ton while planning my CDT thru hike in 2019, and naturally participated in the survey for my year once I’d completed the hike. As my British wife would say regarding those folks who whined or boycotted or belly-ached or whatever: “Take no notice, Luv!” Cheers to you for putting out really helpful hiker data. If the PCT is open for thru hiking in 2021 and I manage to snag a permit (or assemble all the paperwork directly with the related agencies) I’ll be out there going for my triple crown and will plan on pitching in on the survey again. Cheers and best holiday wishes to you and yours! Maxheap (AT 2015, CDT 2019, PCT: tbd)
Thank YOU, friend! Best of luck on your future hiking endeavors. Let’s hope the 2021 hiking season is more successful than 2020.