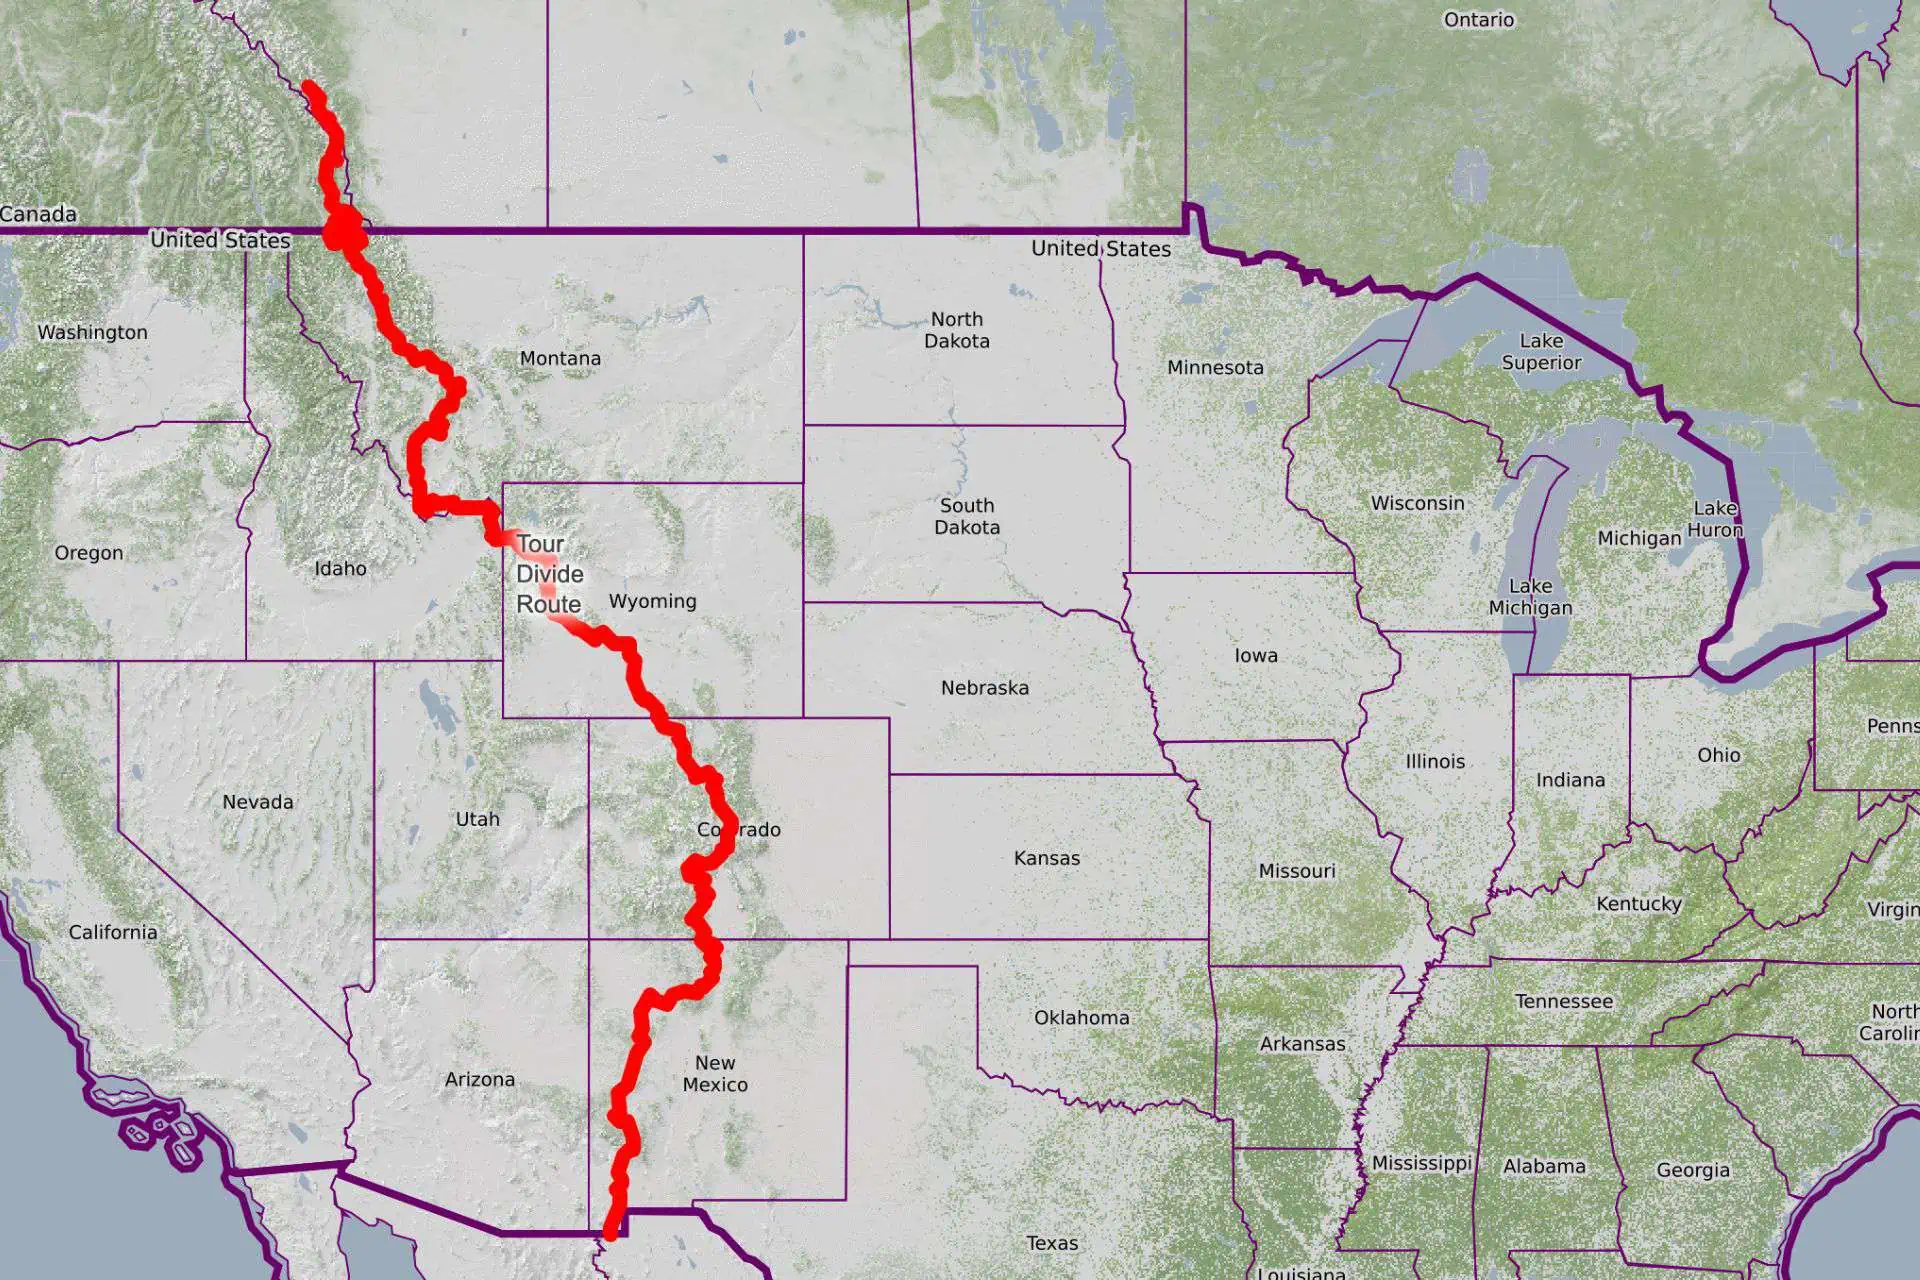
Tour Divide Post Race Report: The Body (What’s Broken)
The Tour Divide did not disappoint. It was as much fun, as much misery, and as much a challenge as I had envisioned. It was possibly the stupidest, most awesome thing I’ve done to date, and I loved it as much as I hated it.
A lot went wrong, a lot surprised me, and the overall statistics still boggle my mind, but one thing I couldn’t have anticipated was what the ride would do to my body. I knew going into it that, despite all my training, my body would be angry with me. How that anger would manifest itself was a mystery to me.
After 2,710.5 mi / 4,362.1 km of pedaling and 174,561 ft / 53,206 m of climbing, I know the truth of this mystery.
Everyone is different. Depending on your history, physique, training, riding conditions, gear, and probably a hundred other factors, your post-Tour Divide assessment may vary significantly. It’s also worth noting that between the end of the Tour Divide in early July and the middle of September, I wasn’t engaged in another long-distance endurance activity; instead, I was doing casual runs, hikes, and rides. However, in mid-September, I began the Pyrenees High Route (on foot).

My Toes
Perhaps the most apparent and longest-lasting effect (damage?) from the Tour Divide was to my toes. At some point during the race, I lost feeling in them. The numbness didn’t bother me too much during the ride or even immediately afterward. What began to worry me was how long the numbness persisted.
For weeks after finishing, I had numbness in all my toes on both feet. Walking barefoot felt strange at first, but eventually I got used to it.
Then, slowly, the feeling started to return. First to my pinky toes, then slowly making its way toward my big toes. However, the sensation of finally being able to feel my toes again seemed to hit a roadblock when reaching my big toes. After weeks and then months, I still didn’t have sensation in either of my big toes. I wasn’t too worried about it – did I really need this sensation? Still, it was interesting that this lasted for so long.
Eventually, I regained all feeling in all my toes (although there’s a chance it’s somewhat diminished as I had never carefully considered my toes’ sensation level before the Tour Divide). There doesn’t appear to be any lasting (toe) damage.

My Feet
I go over this in my breakdown of what went wrong on the Tour Divide, but it’s worth mentioning here as well. In addition to losing feeling in my toes, my feet swelled up significantly during the ride.
My feet are naturally wide, so I bought the widest and most comfortable pair of cycling shoes I could find for the Tour Divide. During training, I had no problems with foot swelling, but I also wasn’t riding 100 miles (160 km) every day for multiple weeks. The fact that my feet swelled up didn’t necessarily bother me (although it’s probably responsible for the loss of feeling in my toes), but I thought it worth noting that they remained swollen for about a week following the end of the race.

My Hands
Perhaps the most unexpected fallout from the Tour Divide was the loss of grip strength in my left hand.
It took me over two weeks to notice this (or maybe it didn’t start until two weeks had passed), but one day while eating dinner, I found myself unable to spear a crouton with a fork. This was neither a particularly hard crouton nor was it a particularly flimsy fork. By every measure, I should have had no issue either successfully impaling the crouton or breaking it into a thousand pieces (as is always the risk when attempting this maneuver).
After switching my fork to my other hand and easily demolishing the fried piece of bread, I asked my uncle to take my hands in his. I told him that I was going to try squeezing both of his hands and asked him to tell me which of my hands felt stronger. Understanding the assignment, he nodded, and I squeezed with both hands.
“Are you only squeezing one at a time, or were you going to squeeze both?” he asked. I was squeezing both. I even felt that I was squeezing my left with a great deal more effort than my right. It was a little frightening at first.
This weakened state of my left hand persisted for about three months after the ride; I honestly didn’t know if I would ever regain my grip strength. I spent a lot of time on my aero bars during the Tour Divide (mostly to take pressure of my saddlesore-covered ass) which could have something to do with it. But I was confused as to why it was only in one hand. The only explanation I could think of was that since I used my right hand to eat, retrieve items from my bags while riding, and use my phone, etc., maybe all the extra pressure on my left hand and arm added up across the entirety of the ride.
Or maybe something completely different, but that sounds like a reasonable explanation, doesn’t it?
My Stress
I wore a Garmin fenix watch for the entirety of my ride (but I recorded and navigated with a Garmin Edge), which meant my heart rate was being recorded at all times.
Based on your heart rate data, Garmin assigns you a daily stress level. According to Garmin, this feature “allows a user to determine their current level of stress based on their heart-rate variability. When using the feature, the watch uses heart rate data to determine the interval between each heartbeat. The variable length of time in between each heartbeat is regulated by the body’s autonomic nervous system. The less variability between beats equals higher stress levels, whereas the increase in variability indicates less stress.”
I know that wrist-based heart rate monitors aren’t the most accurate, and I’m aware that any data a watch provides should be taken with a grain of salt. Still, my stress level during the Tour Divide (according to Garmin) was about as high as it could be. Below is a graph of my weekly averages from the year of the Tour Divide. It isn’t difficult to see where the ride was.
I’ve also included a screenshot of my final day on the Tour Divide, which included a 300+ mile (480+ km) 36-hour push with no sleep to the border. A bit stressful, I’d say.


My Sleep
Sleep was something I expected to get little of on the Tour Divide, and boy, did that expectation come to fruition.
I slept terribly on the Tour Divide (must have been the all-day pushes and the pre-dawn alarms), and my Garmin fenix watch captured it all. According to Garmin, “your nightly sleep score is calculated based on a blend of how long you slept, how well you slept and evidence of recovery activity occurring in your autonomic nervous system derived from heart rate variability data.”
Is it always entirely accurate? Of course not. But I think it did a pretty good job of telling me I slept like shit on the Tour Divide.
That said, one of the things that surprised me on the Tour Divide was how quickly I fell asleep every night. I guess being completely exhausted has its benefits.
As far as after the Tour Divide? No noticeable issues with sleep.


Wrap Up
In the end, if you’re going to race the Tour Divide (opposed to completing it at a touring pace), it’s wise to accept that your body will probably betray you in more ways than you may imagine ahead of time.
Fortunately, I didn’t have any detrimental long-term effects (so far as I can tell) from the ride, but that doesn’t mean I didn’t run the risk of something terrible and irreversable happening to me out there (beyond being mauled by a mountain lion). My hand’s grip strength was the most worrysome (and unexpected) fallout from the ride. Fortunately, it appears to have resolved itself and I can once again stab crutons with a fork ambidextrously.
The other good news (immediately after the ride)? Other than the fact it’s over? My Strava thought I was the fittest person in the universe. Don’t know if I’ll ever top this madeup stat.