Tour Divide Elevation Data and Climbs
When compiling my first Tour Divide stats recap, I realized there was much more to include than would reasonably fit in a single article. I’ve chosen to break up my Tour Divide stats, and here, I’ll focus on every rider’s favorite thing (after thunderstorms and peanut butter mud), elevation, and climbing.
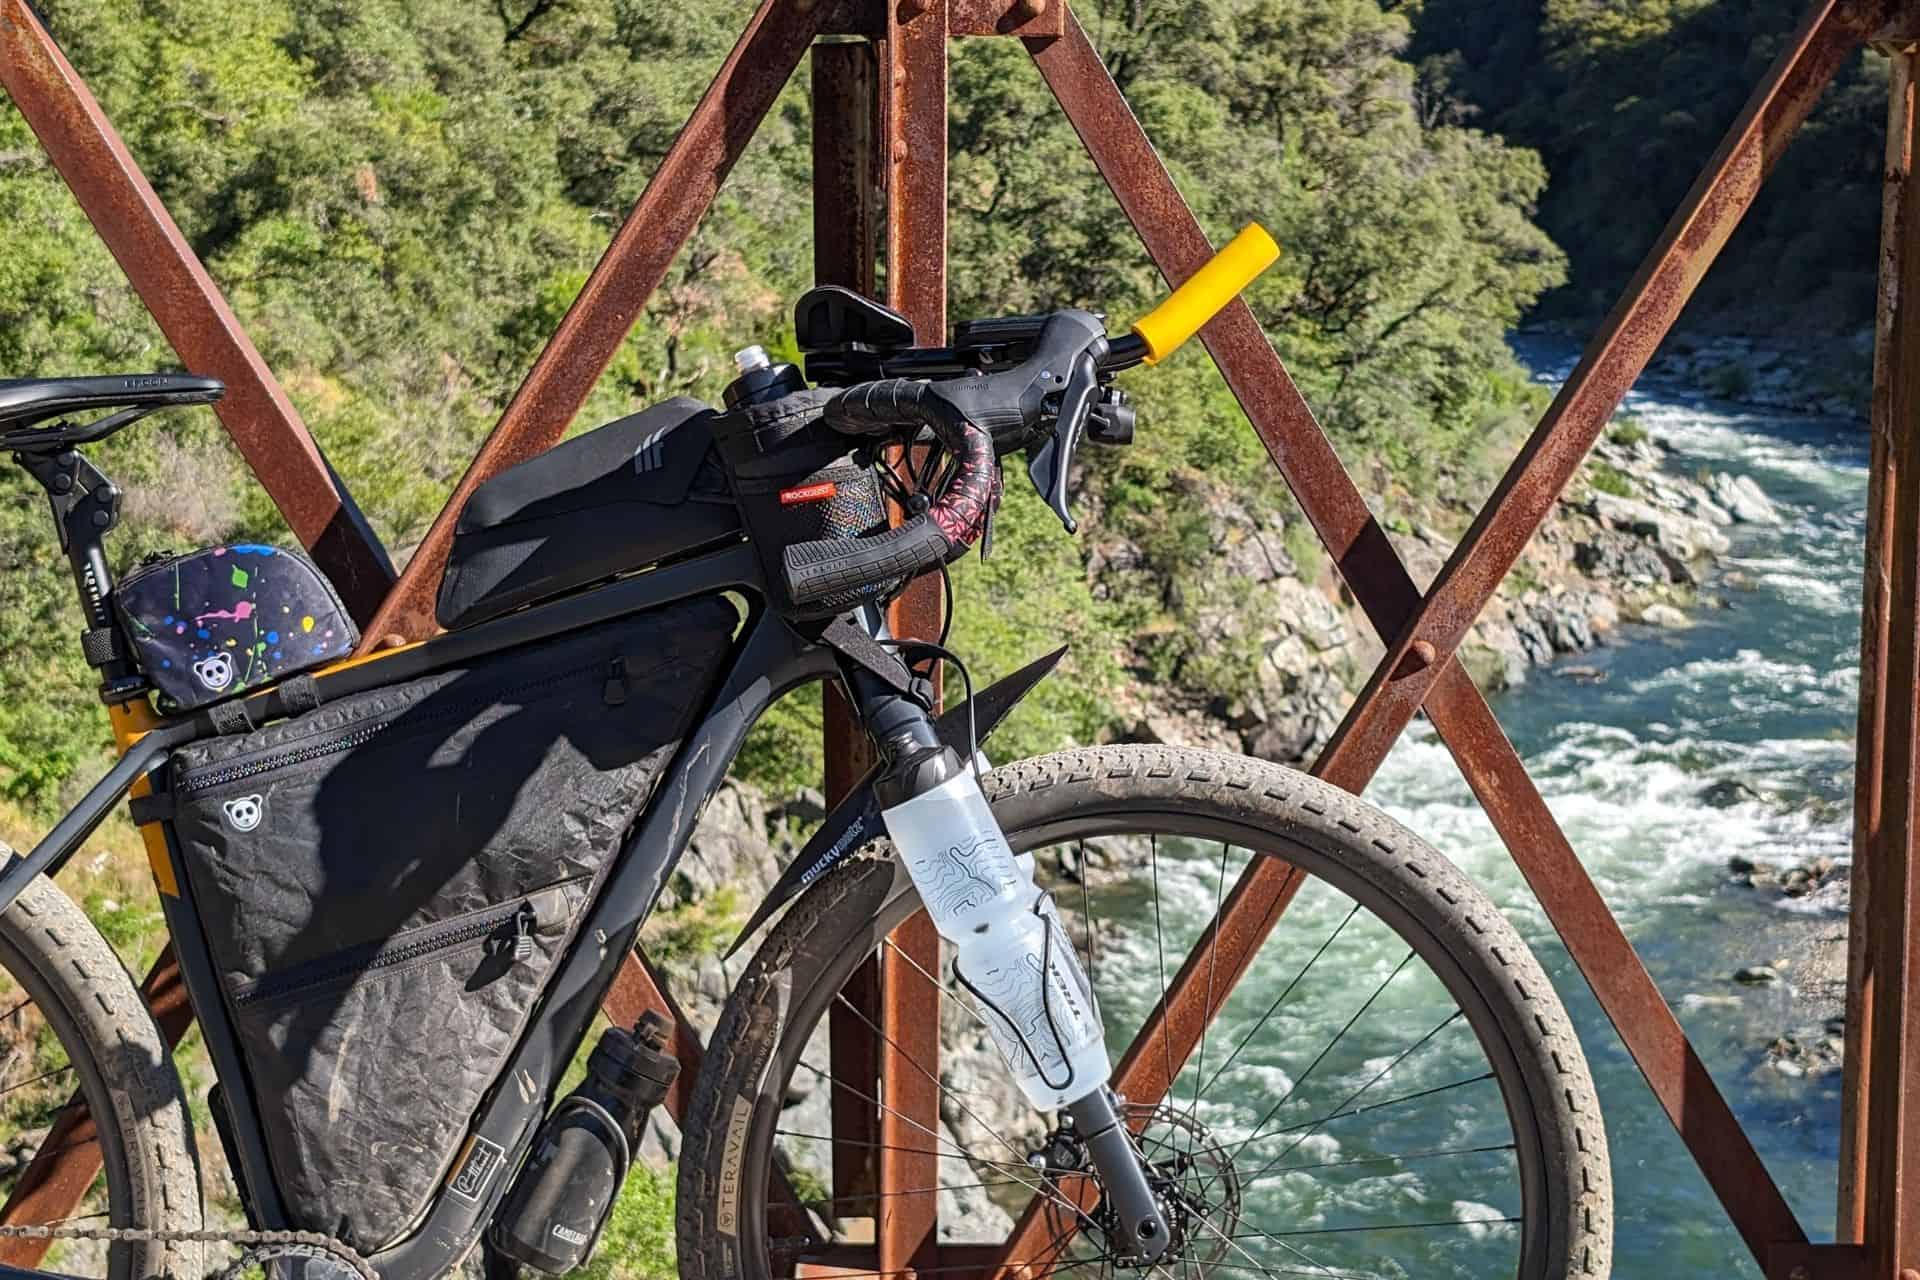
There’s no shortage of elevation change on the Tour Divide, and even the “easy” days fail to offer much respite.
I’ve tried to provide information that’s not only interesting but will hopefully also be helpful to future Tour Divide racers. Obviously, every rider and every year is different, but much of this should remain relatively the same as the course will (maybe?) not shift too dramatically.
If there’s anything that can be added to this data to make it more useful (or something you’re wondering about before you set off on your Tour Divide adventure), please get in touch or leave a comment at the end of this post.

Notes on My Ride
Here are the notes to remember when reviewing the data from my Tour Divide ride. I’ve added more detailed notes for each day further down.
For more stats on my Tour Divide ride, check out this post. For more on what exactly the Tour Divide is (you may be lost being here if you don’t already know), check out this post.
Totals & Averages
- Total Elevation Gain: 174,561 ft / 53,206 m
- Average Daily Elevation Gain: 9,187 ft / 2,800 m (for a time of 19 days, 17 hours, 18 minutes)
- Average Daily Max Elevation: 8,477 ft / 2,584 m
- Average Daily Minimum Elevation: 5,333 ft / 1,625 m
- Average Feet/Mile: 67.29
- Average Meters/Kilometer: 12.75
- Median Daily Maximum Elevation: 7,916 ft / 2,413 m
- Median Daily Minimum Elevation: 5,460 ft / 1,664 m
- Median Elevation Gain: 9,633 ft / 2,936 m
- Median Feet/Mile: 72.65
- Median Meters/Kilometer: 13.77
Most & Least Elevation Change
- Least Elevation Gain in a Day: Day 8 with 4,324 ft / 1318 m of elevation gain from a campsite near Pileup Canyon just outside Lima, Montana, to Warm River Campground in Idaho.
- Most Elevation Gain in a Day: Days 19+20 with 14,062 ft / 4287 m from the Toaster House in Pie Town, New Mexico, to the race’s finish line at the Antelope Wells Border Crossing at the New Mexico-Mexico border.
However, the above stretch was done as a final push to the end and required that I not sleep for the entire time. Since I know the above is a bit outside what could be considered a single day of riding, here are the same stats but only counting days where I slept some.
- Most Elevation Gain in a Day: Day 7 with 11,591 ft / 3,533 m from Butte, Montana, to just outside Lima, Montana. This was followed very closely by Day 9, where I had 11,581 ft / 3,530 m of climbing (just 10 ft / 3 m less) from Warm River Campground, just west of the Idaho-Wyoming border, to the Strawberry Safety Shelter located over Union Pass.
But since the above numbers depend on the miles I traveled each day and the hours I was riding my bike, here are the days with the least and the most elevation gain per mile/kilometer.
- Least Elevation Change per Mile/Kilometer: Same as the least elevation gain above, Day 8 with 4,324 ft / 1318 m of elevation gain from a campsite near Pileup Canyon just outside Lima, Montana, to Warm River Campground in Idaho. The average elevation gain this day was 28.37 ft per mile / 5.38 m per kilometer.
- Most Elevation Change per Mile/Kilometer: On Day 6, I gained an average of 95.46 ft per mile / 18.09 m per kilometer from the Llama Ranch to Butte, Montana. On this day, I covered 118.12 mi / 190.06 km and gained 11,276 ft / 3438 m in total elevation.

Daily Elevation Breakdown
Day 1
- Start: Banff, Alberta, Canada
- End: Valley west of Koko Claims
- Elevation gain: 10,476 ft / 3,193 m
- Max elevation: 6,732 ft / 2,052 m
- Min elevation: 4,239 ft / 1,292 m
- Average ft/mi: 94.84
- Average m/km: 17.97
- Passes: Elk Pass, Koko Pass
- Notes: Koko Claims (steep hike-a-bike), Alberta-British Columbia border
Day 2
- Start: Valley west of Koko Claims
- End: Ram-Wigwam Creek Recreation Site
- Elevation gain: 8,753 ft / 2,669 m
- Max elevation: 5,674 ft / 1,729 m
- Min elevation: 3,173 ft / 967 m
- Average ft/mi: 68.18
- Average m/km: 12.92
- Passes: Cabin Pass
- Towns: Fernie, BC
Day 3
- Start: Ram-Wigwam Creek Recreation Site
- End: Whitefish, Montana
- Elevation gain: 10,528 ft / 3,210 m
- Max elevation: 6,205 ft / 1,891 m
- Min elevation: 2,561 ft / 781 m
- Average ft/mi: 77.88
- Average m/km: 14.76
- Passes: Galton Pass, Whitefish Divide, Red Meadow Pass
- Towns: Eureka, MT; Whitefish, MT
- Notes: The Wall, US-Canada border
Day 4
- Start: Whitefish, Montana
- End: Holland Lake
- Elevation gain: 4,800 ft / 1,464 m
- Max elevation: 4,933 ft / 1,504 m
- Min elevation: 2,996 ft / 913 m
- Average ft/mi: 42.46
- Average m/km: 8.05
- Passes: None
- Towns: Columbia Falls, MT; Ferndale, MT; Condon, MT
Day 5
- Start: Holland Lake
- End: Llama Ranch
- Elevation gain: 10,883 ft / 3318 m
- Max elevation: 6,838 ft / 2,084 m
- Min elevation: 4,055 ft / 1,236 m
- Average ft/mi: 90.50
- Average m/km: 17.15
- Passes: Richmond Peak Pass, Huckleberry Pass, Stemple Pass
- Towns: Ovando, MT; Lincoln, MT
Day 6
- Start: Llama Ranch
- End: Butte, Montana
- Elevation gain: 11,276 ft / 3438 m
- Max elevation: 7,389 ft / 2,252 m
- Min elevation: 3,961 ft / 1,207 m
- Average ft/mi: 95.46
- Average m/km: 18.09
- Passes: Priest Pass, Grizzly Gulch Pass, Lava Mountain Pass
- Towns: Helena, MT; Basin, MT; Butte, MT
Day 7
- Start: Butte, Montana
- End: Pileup Canyon
- Elevation gain: 11,591 ft / 3,534 m
- Max elevation: 7,916 ft / 2,413 m
- Min elevation: 5,460 ft / 1,664 m
- Average ft/mi: 72.65
- Average m/km: 13.77
- Passes: None
- Towns: Wise River, MT
- Notes: Fleecer Ridge
Day 8
- Start: Pileup Canyon
- End: Warm River Campground (Idaho)
- Elevation gain: 4,324 ft / 1,318 m
- Max elevation: 7,143 ft / 2,177 m
- Min elevation: 5,320 ft / 1,622 m
- Average ft/mi: 28.37
- Average m/km: 5.38
- Passes: Red Rock Pass
- Towns: Lima, MT; Island Park, ID
- Notes: Montana-Idaho border
Day 9
- Start: Warm River Campground
- End: Strawberry Safety Shelter
- Elevation gain: 11,581 ft / 3,531 m
- Max elevation: 9,751 ft / 2,972 m
- Min elevation: 5,313 ft / 1,619 m
- Average ft/mi: 81.43
- Average m/km: 15.43
- Passes: Togwotee Pass, Union Pass
- Towns: Flag Ranch (Grand Teton)
- Notes: Togwotee Mountain Lodge, Lava Mountain Lodge
Day 10
- Start: Strawberry Safety Shelter
- End: Great Divide Basin
- Elevation gain: 8,734 ft / 2,663 m
- Max elevation: 9,184 ft / 2,799 m
- Min elevation: 6,727 ft / 2,050 m
- Average ft/mi: 43.49
- Average m/km: 8.24
- Passes: None
- Towns: Pinedale, WY; Boulder, WY; South Pass City, WY; Atlantic City, WY
- Notes: Great Divide Basin
Day 11
- Start: Great Divide Basin
- End: Brush Mountain Lodge (Colorado)
- Elevation gain: 5,774 ft / 1,760 m
- Max elevation: 7,858 ft /2,395 m
- Min elevation: 6,473 ft / 1,973 m
- Average ft/mi: 47.71
- Average m/km: 9.04
- Passes: Mendon Peak
- Towns: Warmsutter, WY; Savery, WY
- Notes: Wyoming-Colorado border
Day 12
- Start: Brush Mountain Lodge (Colorado)
- End: North of Radium Recreation Area
- Elevation gain: 8,363 ft / 2,550 m
- Max elevation: 9,853 ft / 3,003 m
- Min elevation: 6,674 ft / 2,034 m
- Average ft/mi: 79.63
- Average m/km: 15.09
- Passes: Lynx Pass
- Towns: Steamboat Springs, CO
- Notes: Stopped in Steamboat Springs for too long because of bike work
Day 13
- Start: North of Radium Recreation Area
- End: South of Hartsel, Colorado
- Elevation gain: 10,837 ft / 3,304 m
- Max elevation: 11,487 ft / 3,501 m
- Min elevation: 6,882 ft / 2,098 m
- Average ft/mi: 70.38
- Average m/km: 13.34
- Passes: Ute Pass, Boreas Pass
- Towns: Silverthorne, CO; Frisco, CO, Breckenridge, CO; Como, CO; Hartsel, CO
Day 14
- Start: South of Hartsel, Colorado
- End: Homestead Gulch
- Elevation gain: 7,667 ft / 2,338 m
- Max elevation: 10,856 ft / 3,309 m
- Min elevation: 7,116 ft / 2,169 m
- Average ft/mi: 69.95
- Average m/km: 13.25
- Passes: Marshall Pass
- Towns: Salida, CO; Poncha Springs, CO; Sargents, CO
- Notes: Stopped early by storm
Day 15
- Start: Homestead Gulch
- End: Highway 17
- Elevation gain: 11,358 ft / 3,463 m
- Max elevation: 11,945 ft / 3,641 m
- Min elevation: 7,834 ft / 2,388 m
- Average ft/mi: 74.99
- Average m/km: 14.21
- Passes: Cochetopa Pass, Carnero Pass, Indiana Pass, Stunner Pass
- Towns: Del Norte, CO; Platoro, CO
- Notes: High point of the route, Indiana Pass
Day 16
- Start: Highway 17
- End: Abiquiu, New Mexico
- Elevation gain: 8,491 ft / 2,589 m
- Max elevation: 10,945 ft / 3,336 m
- Min elevation: 5,914 ft / 1,803 m
- Average ft/mi: 81.55
- Average m/km: 15.45
- Passes: La Manga Pass
- Towns: Abiquiu, NM
- Notes: Colorado-New Mexico border, long CDT hike-a-bike stretch
Day 17
- Start: Abiquiu, New Mexico
- End: Chaco Trade Center (New Mexico)
- Elevation gain: 9,633 ft / 2,937 m
- Max elevation: 10,329 ft / 3,148 m
- Min elevation: 6,005 ft / 1,830 m
- Average ft/mi: 76.39
- Average m/km: 14.48
- Towns: Cuba, NM
Day 18
- Start: Chaco Trade Center (New Mexico)
- End: Pie Town, New Mexico
- Elevation gain: 5,430 ft/ 1,656 m
- Max elevation: 7,732 ft / 2,357 m
- Min elevation: 6,336 ft / 1,931 m
- Average ft/mi: 38.16
- Average m/km: 7.23
- Towns: Grants, NM; Pie Town, NM
Day 19+20
- Start: Pie Town, New Mexico
- End: Antelope Wells / US-Mexico Border
- Elevation gain: 14,062 ft / 4,287 m
- Max elevation: 8,288 ft / 2,526 m
- Min elevation: 4,280 ft / 1,305 m
- Average ft/mi: 44.45
- Average m/km: 8.42
- Towns: Silver City, NM; Separ, NM; Hachita, NM
- Notes: Multiple CDT overlaps
Elevation Profiles


Wrap Up
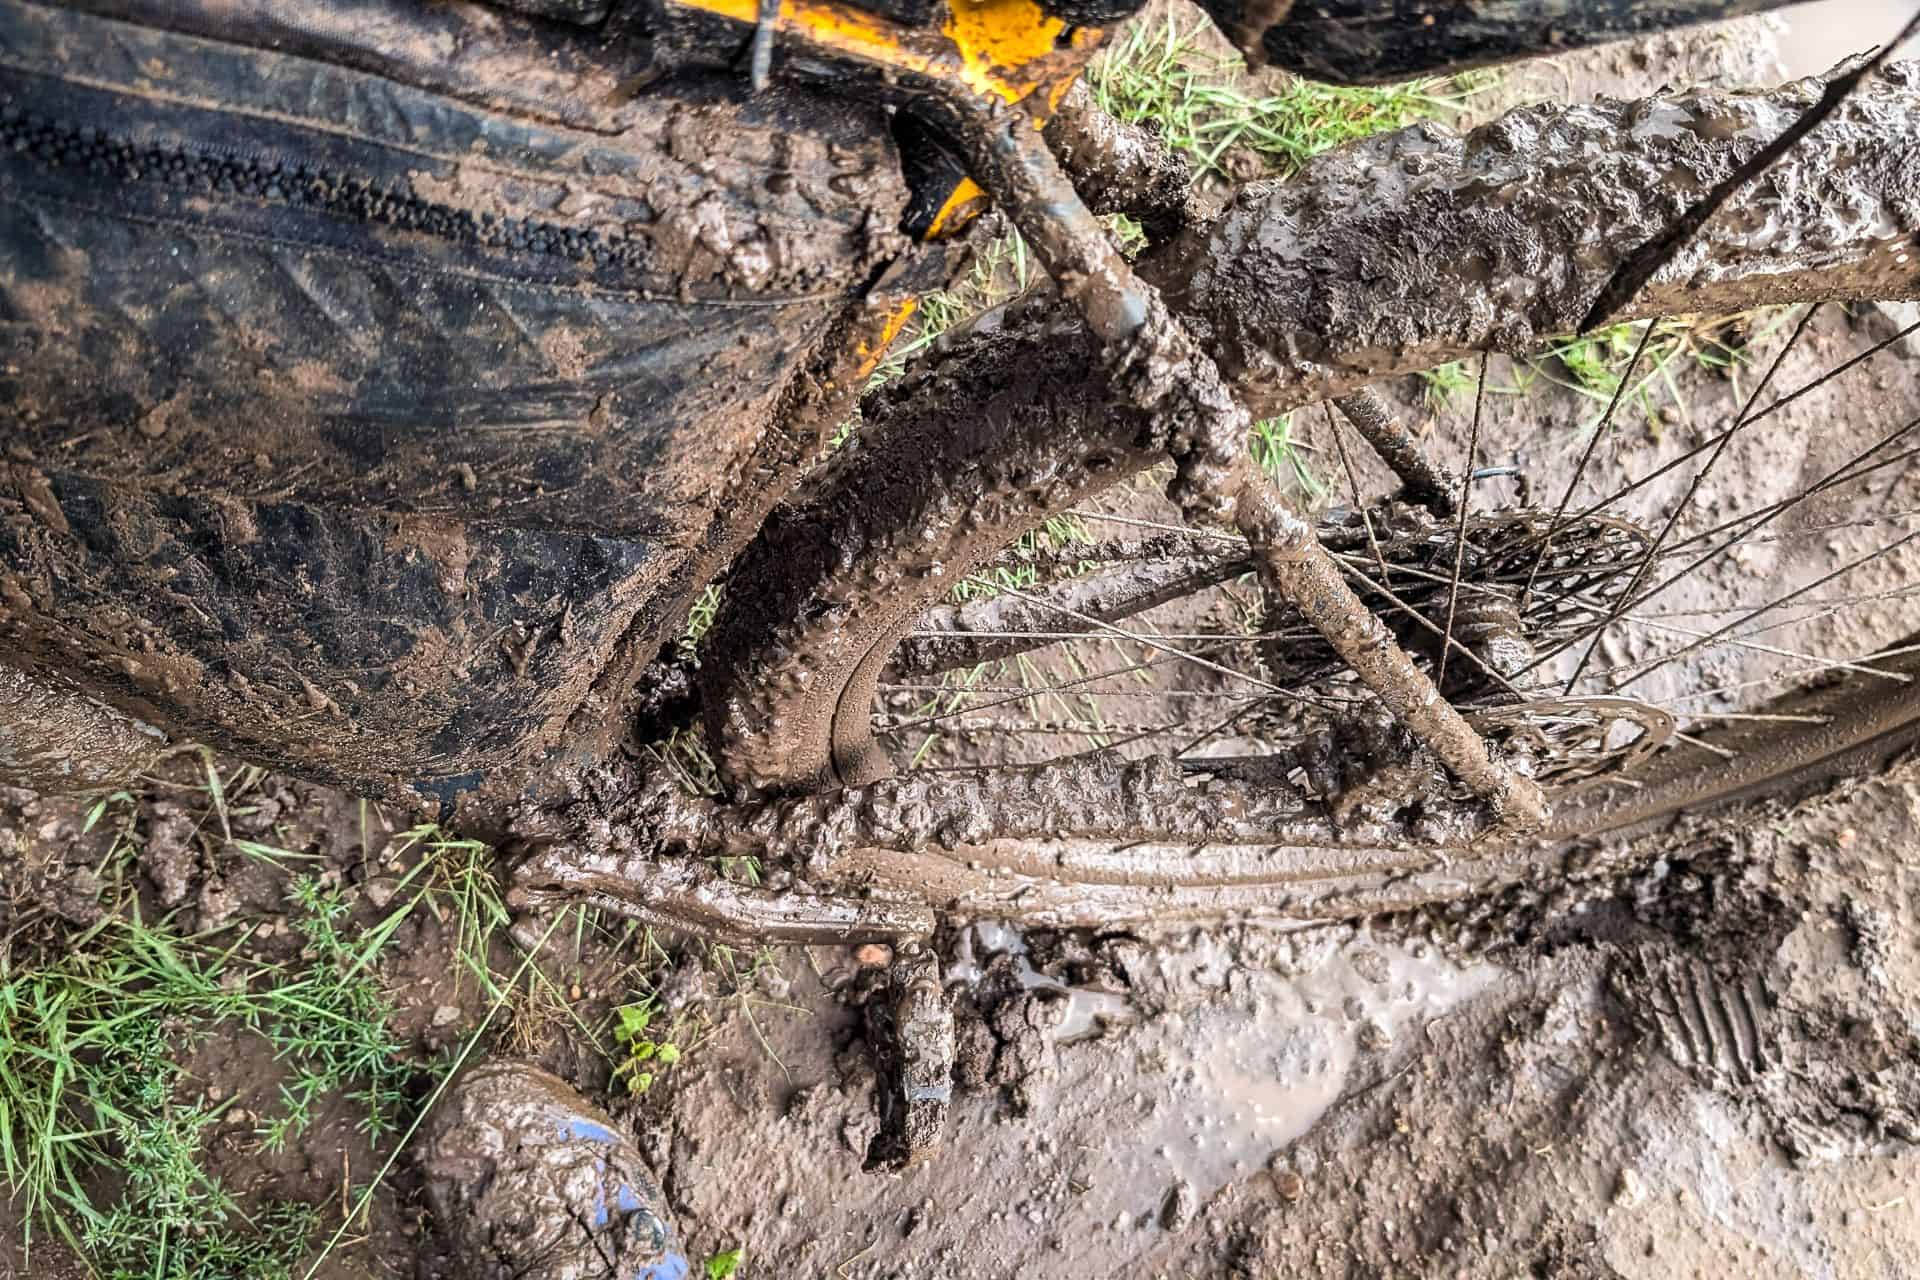
No matter how you cut it, the Tour Divide is an incredibly challenging undertaking. Don’t fool yourself by thinking some days will be easier than others just because there’s less climbing or fewer passes. The wind, the rain, the mud, your bike, your joints, or your nutrition always lurks around the corner, waiting to ruin your day on the Tour Divide.
That said, elevation change can bring shifting weather conditions, increased demand on your body, or increased speed—something that can often be fun, but sometimes not so much if you’re working on two hours of sleep and navigating a chunky downhill next to a huge dropoff.
Best to know what you’re getting yourself into, right? Not right? Whatever, it’s going to suck regardless (but also be awesome).
Is there any data I missed? Is there anything that would be helpful to include? Comment below and let me know; I will respond and add it here. Alternatively, if you hiked the Hayduke, share your data, and maybe we can get enough to put together some interesting comparisons.