The Continental Divide Trail Hiker Survey (2021)
After an interesting year of Continental Divide Trail thru-hiking and CDT survey results in 2020, we’re back up and running with a (more) normal year in 2021. The CDT Survey is in its fifth year and I would like to extend a huge THANK YOU to everyone who took the time to participate.
The CDT Survey is meant to be a useful resource to (actually) help those of you interested in hiking the Continental Divide Trail figure out how to approach this monstrous journey. Every year, I try to improve the data collected and fine-tune the presentation to best help hikers. I would love to hear what you think in the comments below.
Congratulations on arriving at a spot in the CDT Survey that most readers have probably skipped. Here are the results of Halfway Anywhere’s 2021 Continental Divide Trail Hiker Survey!

Notes on the data
- This year’s survey boasts the most-ever respondents with 216 completed surveys – a 23% increase vs the previous high.
- Some responses are sorted and colored to make the data friendlier (e.g. northbound vs. southbound).
- I ask that respondents do their best to accurately respond to the survey. Not every person answers every question and not every answer is guaranteed to be 100% accurate (e.g. someone may mistakenly report 11 instead of 12 zero days).
- I refer to survey respondents collectively as this year’s “class“. Remember, this is a sample and not a comprehensive survey of every person on the CDT.
- This survey does invoke some math. I suggest you familiarize yourself with the words average, median (M), and standard deviation (σ).
- For stats requiring the length of the CDT for a calculation (e.g. mileage/day), I use 3,100 mi / 4,989 km.
- More detailed posts focused on CDT Gear, CDT Resupply, CDT Horror Stories, and CDT Advice in the coming weeks. If you would like to be notified of new surveys, click here.
LABELS differentiating hiker segments:
- THRU: Thru-hikers (all)
- THRU-0: Thru-hikers who did NOT complete the CDT
- THRU-1: Thru-hikers who completed the entire CDT
- NOBO: Northbound thru-hikers (all)
- NOBO-0: Northbound thru-hikers who did NOT complete the CDT
- NOBO-1: Northbound thru-hikers who completed the CDT
- SOBO: Southbound thru-hikers (all)
- SOBO-0: Southbound thru-hikers who did NOT complete the CDT
- SOBO-1: Southbound thru-hikers who completed the CDT
If NO LABEL has been appended to a data point, then I used all data collected (i.e. it includes section hiker data in addition to thru-hiker data).
Demographics
First, we look at information from the Continental Divide Trail Class of 2021 that isn’t going to help anyone plan a thru-hike, but that’s interesting nonetheless. We’ll look at CDT hiker gender, age, race, education, sexual orientation (added this year), country/state of origin, and employment (including how hikers were able to have time enough off to hike the CDT).
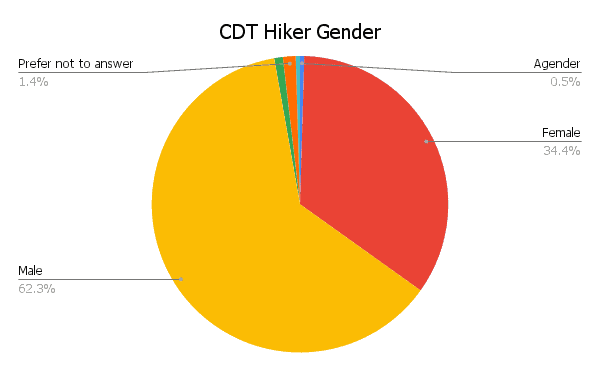
CDT Hiker Gender
- 62.3% Male
- 34.4% Female
- 0.9% Non-binary
- 0.5% Agender
- 0.5% Trans non-binary
- 1.4% Decline to answer
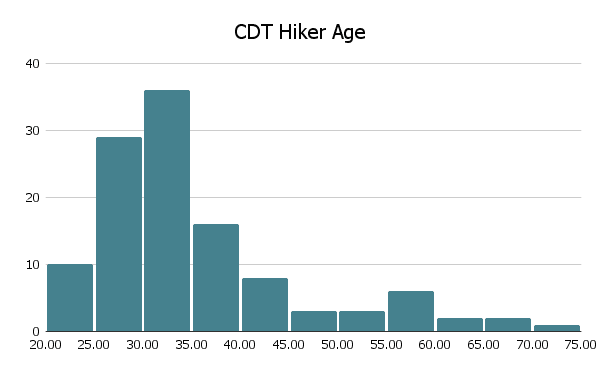
CDT Hiker Age
- 0% < 20
- 8.62% 20-24
- 25% 25-29
- 31.03% 30-34
- 13.79% 35-39
- 9.48% 40-49
- 7.76% 50-59
- 3.45% 60-69
- 0.86% >70
Average age: 35
Median age: 32
σ: 11
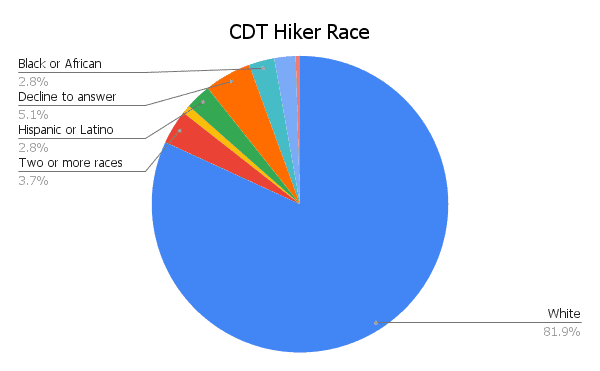
CDT Hiker Race
- 81.9% White
- 3.7% Two or More Races
- 2.8% Hispanic or Latino
- 2.8% Black or African American
- 2.3% Asian
- 0.9% Native Hawaiian or other Pacific Islander
- 0.5% American Indian or Alaska Native
- 5.1% Decline to answer
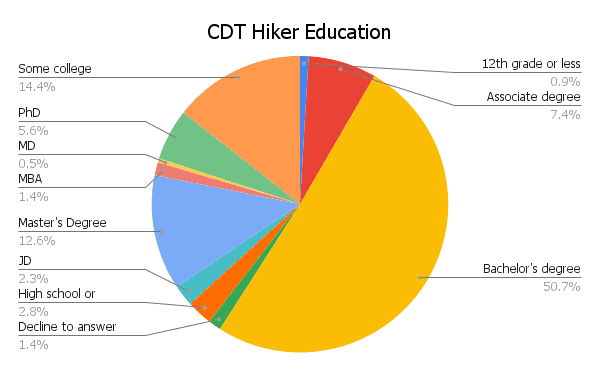
CDT Hiker Education
- 50.7% Bachelor’s degree
- 14.4% Some college (no degree)
- 12.6% Master’s degree
- 7.4% Associate degree
- 5.6% PhD
- 2.8% High school or equivalent
- 2.3% JD
- 1.4% MBA
- 0.9% 12th grade or less
- 0.5% MD
- 1.4% Decline to answer
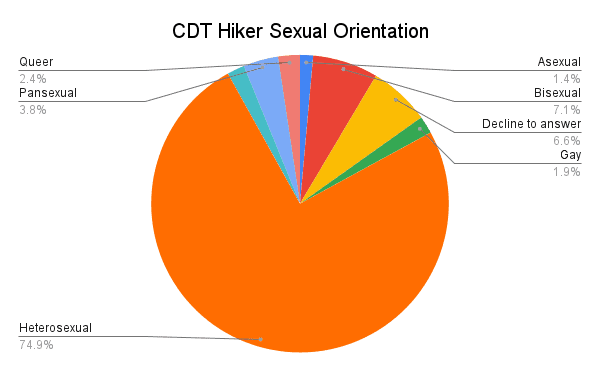
CDT Hiker Sexual Orientation
- 74.9% Heterosexual (straight)
- 7.1% Bisexual
- 3.8% Pansexual
- 2.4% Queer
- 1.9% Gay
- 1.9% Lesbian
- 1.4% Asexual
- 6.6% Decline to answer
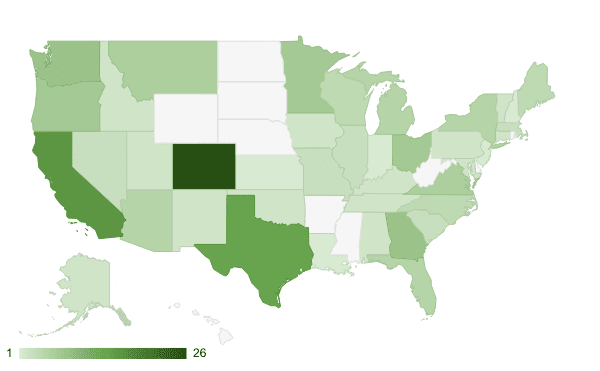
Where Hikers Are From
With thru-hiking’s growing popularity, the Continental Divide Trail attracts people from across the United States and the world. Here’s a look at where hikers on the trail this year hailed from.
- Countries: Brazil, Canada, Denmark, Germany, Israel, Russia, Switzerland, United Kingdom, United States (9 TOTAL)
- States: Alabama, Alaska, Arizona, California, Colorado, Connecticut, Florida, Georgia, Idaho, Illinois, Indiana, Iowa, Kansas, Kentucky, Louisiana, Maine, Maryland, Massachusetts, Michigan, Minnesota, Missouri, Montana, Nevada, New Hampshire, New Jersey, New Mexico, New York, North Carolina, Ohio, Oklahoma, Oregon, Pennsylvania, Puerto Rico, South Carolina, Tennessee, Texas, Utah, Vermont, Virginia, Washington, Wisconsin (41 TOTAL)
Worldwide CDT hiker distribution
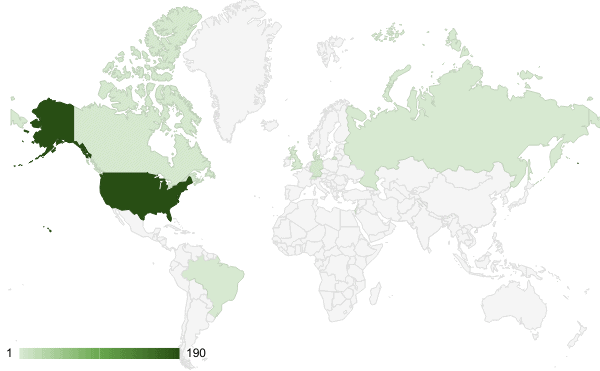
Domestic CDT hiker distribution
THE MOST-REPRESENTED COUNTRIES
- USA – 91.3%
- Germany – 3.4%
- Canada – 2.4%
- United Kingdom – 1%
THE MOST-REPRESENTED STATES
- Colorado – 14.1%
- California – 8.7%
- Texas – 7.6%
- Georgia, Washington – 4.3%
- Minnesota, Ohio, Oregon – 3.8%
Hiker Jobs & Working Conditions
How are you able to take so much time off to hike for five months across the United States? Probably a question most would-be Continental Divide Trail hikers have been asked. I asked hikers what they do for work (when they’re not being incredible hiking machines) and how they were able to take time off to hike the CDT.
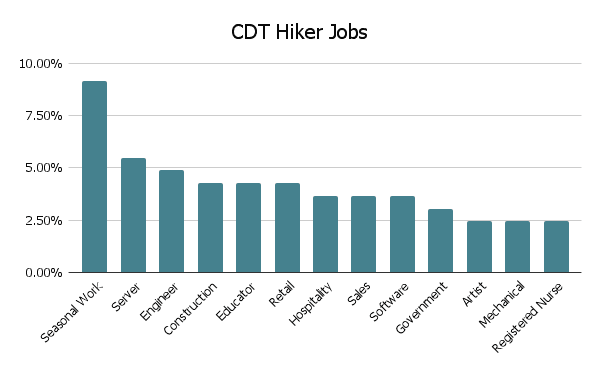
CDT Hiker Jobs
This year, hikers reported 45 different professions. The most common of which were:
- 9.2% Seasonal Work
- 5.5% Server
- 4.9% Engineer
- 4.3% Construction
- 4.3% Educator
- 4.3% Retail
- 3.7% Hospitality
- 3.7% Sales
- 3.7% Software Engineer
11.6% (larger than any single profession) reported being retired and 6.1% were students. More on this in the next section.
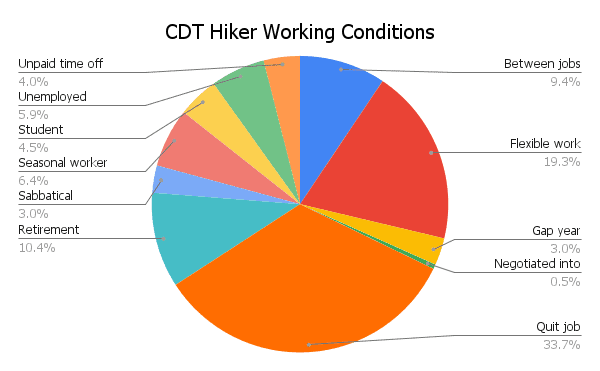
CDT Hiker Working Conditions
How was this year’s class able to take time off to hike the CDT?
- 33.7% Quit job
- 19.3% Flexible work conditions
- 10.4% Retired
- 9.4% Between jobs
- 5.9% Unemployed
- 4.5% Student
- 4% Unpaid time off
- 3% Sabbatical
- 3% Gap year
- 6.4% Seasonal Worker
- 0.5% Negotiated into employment
Hiker Experience
Here’s a look at what the 2021 class looked like during their “Planning a CDT Hike” phase. This section examines first-time hikers, hiker experience level, and other trails hiked.
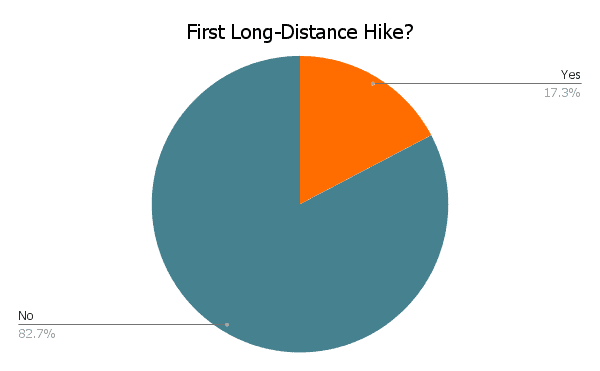
First long-distance hike?
Instead of asking respondents whether this would be/was their first long-distance hike, I ask the distance of respondents’ longest hike to date (pre-CDT) – more on the specifics of this below. I decided to use 100 mi / 160 km as the cutoff for being considered to have completed a long-distance hike (sorry, Wonderland Trail hikers). If you want to yell at me for the arbitrary number I chose here (or suggest a better one), feel free to do so in the comments at the end of this post.
First Time Hikers
- 17.3% Yes
- 82.7% No
Average longest trail hiked: 1,683 mi / 2,709 km
Median: 2,193 mi / 3,513 km
CDT Hiker Experience
In addition to asking the longest trail completed by hikers pre-CDT, I ask respondents to evaluate their level of backpacking experience on a scale of 1 to 10.
- Average experience: 8.29
- Median experience: 10
- σ: 2.59
THRU-1: 8.57 (σ = 2.39)
THRU-0: 7.50 (σ = 3.23)

Note: this graph won’t display correctly if I make 10 the upper limit. This is why you see 11 as the max despite the scale hikers used being 0 to 10.
Previous Trails Hiked
The trails most commonly hiked by those with experience were:
- 55.4% Pacific Crest Trail
- 41.8% Appalachian Trail
- 22.0% Colorado Trail
- 18.1% John Muir Trail
- 12.4% CDT Section Hike
- 12.4% Long Trail
- 10.7% Arizona Trail
- 10.7% Camino de Santiago
- 9.0% PCT Section Hike
- 8.5% AT Section Hike
- 6.2% Tahoe Rim Trail
- 4.5% Te Araroa
- 3.4% PNT
- 2.8% Florida Trail
- 2.8% Hayduke
- 1.7% CDT

Note: these percentages are of the hikers who have already completed a long-distance hike, not of the entire class.
Pre-hike Training
Next, we’ll look at whether this year’s class trained in preparation for their thru-hikes, what they did to train, and how they rated their fitness (pre-CDT).
Did hikers train?
- 72.1% Yes
- 27.95% No

How Hikers Trained
- 48.4% Day Hikes
- 18.3% Running
- 13.6% Multi-day Hikes
- 6.2% Bicycling
- 4.7% Cross-Training
- 4% Weight Training
- 3.5% Step Machine
- 1.5% Other

Pre-trail Fitness Level
I asked hikers to rate their level of fitness (on a scale of 0 to 10) before beginning the trail.
Average fitness: 6.01
Median fitness: 6
σ: 1.73
THRU-1: 6.06 (σ = 1.81)
THRU-0: 6.00 (σ = 1.51)

Note: this graph won’t display correctly if I make 10 the upper limit. This is why you see 11 as the max despite the scale hikers used being 0 to 10.
Money Spent on Hike
How much does it cost to hike the Continental Divide Trail? A question on the minds of many thru-hikers before starting their journeys. The safe answer? More than you think.
THRU-1
$7,070
The average amount spent on the entirety of a thru-hike
M = $7,000 | σ = $2,711
THRU-1
$50
The average amount spent per day on a thru-hike
M = $49 | σ = $18
THRU
$1,052
The average amount spent on gear before starting
M = $1,000 | σ = $828


THRU-1
$7,117
Average spent by domestic thru-hikers
M = $7,000 | σ = $2,789
THRU-1
$6,724
Average spent by international thru-hikers
M = $6,500 | σ = $2,078
This year, I asked Continental Divide Trail hikers if they encountered any unexpected expenses while hiking the CDT. Because even if you purchase and test all your gear beforehand and pre-package all of your resupplies (I strongly recommend against this strategy), you can’t ever predict what’s going to happen during a CDT thru-hike.
Surprise Expenses Encountered
- 51% Yes
- 49% No
Unexpected expenses fell into basically three categories: gear replacements, hotel stays, and travel along the trail. However, a few hikers did report some towns being unexpectedly pricey and medical expenses in addition to these three larger reasons.

Unexpected Expense Breakdown
49.5% Replacing gear
- 41.6% replacing failing gear
- 7.9% replacing hated gear
35.9% Hotel stays
- 14.6% due to injury
- 11.2% due to weather
- 10.1% due to illness
7.9% Travel along the trail
- 3.4% due to fires
- 3.4% due to injury
- 1.1% due to weather
4.5% Towns more expensive than expected
1.1% Medical expenses

Hiking Partners & Alone Time
Beginning a thru-hike on your own can sound scary and intimidating, but every year, the majority of thru-hikers (and hikers in general) began their hikes alone. Here, we’ll look at who hikers began with, how much time they spent hiking and camping alone, whether they stayed with their hiking partner(s), hiking group sizes, and hiker relationships.
Did hikers begin alone?
- 50.9% Yes
- 22.6% Began with a partner or spouse
- 20.3% Began with a friend(s)
- 5.7% Arranged to start with other hikers (whom they had not met before beginning the CDT)
- 0.5% Began with family member(s)
Of this year’s first-time thru-hikers, 37.9% began their hikes alone (the data above/in the graph is for all hikers).

Percentage of time hiking alone
- 11.7% – 0%
- 6.1% – 1-9%
- 6.1% – 10-24%
- 8.9% – 25-49%
- 19.2% – 50-74%
- 19.6% – 75-89%
- 24.3% – 90-99%
- 4.2% – 100%
57.7% – Average time thru-hikers spent hiking alone
σ = 34.5 | M = 70%

“Hiking alone” measures the amount of time that hikers weren’t physically walking with someone down the trail. It does not necessarily imply they weren’t hiking with others throughout the day (i.e. camping with others).
Percentage of nights camping alone
- 24.8% – 0%
- 14% – 1-9%
- 8.4% – 10-24%
- 12.1% – 25-49%
- 15% – 50-74%
- 7.9% – 75-89%
- 14% – 90-99%
- 2.8% – 100%

37% was the average percentage of nights thru-hikers, spent camping alone (σ = 35 | M = 30). When we look at thru-hikers who finished, this translates to an average of 48 nights spent camping alone.
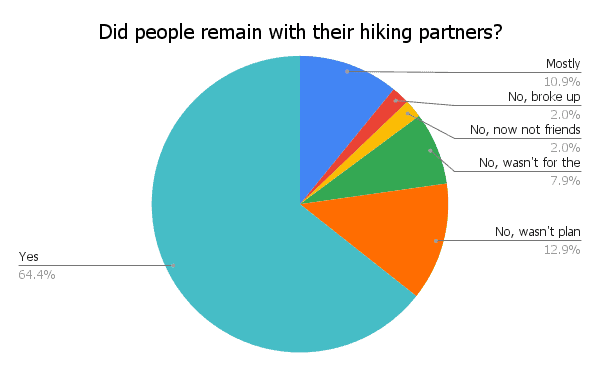
Sticking With Hiking Partner(s)
Beginning a hike with someone is one thing, but managing to remain together and finishing a hike with someone is arguably as impressive as the trail itself. Here’s how things worked out for those who began their hikes with another person.
Did hikers remain with partner(s)?
- 64.4% Yes
- 12.9% No, this was never the plan
- 10.9% Yes, for the most part
- 7.9% No, we decided it wasn’t for the best
- 2% No, we’re no longer friends
- 2% No, relationship ended
Size of Hiking Groups
Despite the majority of hikers beginning their Continental Divide Trail hikes alone, most hikers will link up and hike with at least one other person for a considerable amount of their time on the CDT. Some hikers refer to this as a trail family or “tramily“. Here are the largest groups hikers found themselves hiking with on a regular basis.
Average group size: 4.4
Median size: 4
σ: 3.3

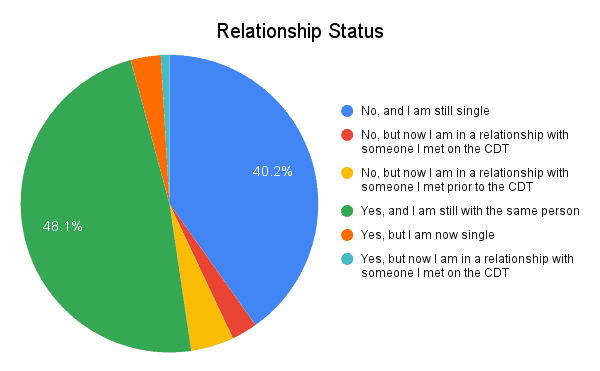
Relationship Status
- 48.1% Yes, and I am still with the same person
- 40.2% No, and I am still single
- 4.7% No, but now I am in a relationship with someone I met before the CDT
- 3.3% Yes, but I am now single
- 2.8% No, but now I am in a relationship with someone I met on the CDT
- 0.9% Yes, but now I am in (a different) relationship with someone I met on the CDT
Starting Dates & Locations
Unlike the Pacific Crest Trail, the Continental Divide Trail does not have a permit that hikers are issued for the entirety of the trail. Instead, hikers can begin the CDT at either the southern or northern terminus whenever they choose – for now. That said, a permit is required to hike through Glacier National Park from the northern terminus (or from the south).
Northbound CDT Hikers
Since getting to what’s generally considered to be the official southern terminus at Crazy Cook isn’t easy, the Continental Divide Trail Coalition operates a (paid) shuttle service. In recent years, a few private individuals have also started independent (for-profit) shuttle operations. In this section, we’ll go over where northbound CDT hikers began, when they began, and how they got to the southern terminus.
Northbound Start Location
- 99.1% Crazy Cook Monument
- 0.9% Lordsburg
It looks like the alternate locations for beginning a CDT thru-hike (usually Columbus or Antelope Wells) aren’t as popular as they once were.

Northbound Start Dates
- April Starts: 81.1%
- May Starts: 14.4%
- Earliest: March 1
- Latest: June 6

NOBO
April 19
Average start date
NOBO
April 13
Average start date of hikers who said they would like to have started later
NOBO
May 3
Average start date of hikers who said they would like to have started earlier
How Hikers Reached Crazy Cook
- 40% Crazy Cook Shuttle
- 31.3% Private Transportation
- 22.5% CDTC Shuttle
- 5% Trail Angel
- 1.3% Walked

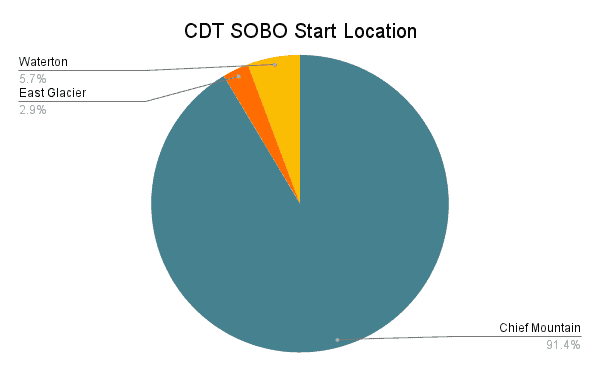
Southbound CDT Hikers
Just as there are options for starting points for northbound CDT hikers, there are also options for southbound CDT hikers. This section covers where southbound CDT hikers began, when they began, and how they got back from the southern terminus (those that completed the trail).
Southbound Start Location
- 91.4% Chief Mountain
- 5.7% Waterton Lake
- 2.9% East Glacier
Southbound Start Dates
- June Starts: 76.1%
- July Starts: 23.9%
- Earliest: June 2
- Latest: July 17

SOBO
June 25
Average starting date
SOBO
June 10
Average starting date of hikers who said they would like to have started later
SOBO
June 29
Average starting date of hikers who said they would like to have started earlier
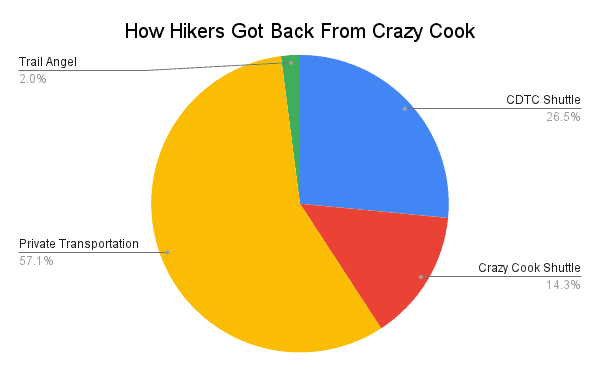
How Hikers Returned from Crazy Cook
- 57.1% Private Transportation
- 26.5% CDTC Shuttle
- 14.4% Crazy Cook Shuttle
- 2% Trail Angel
Hiking Stats & Dates
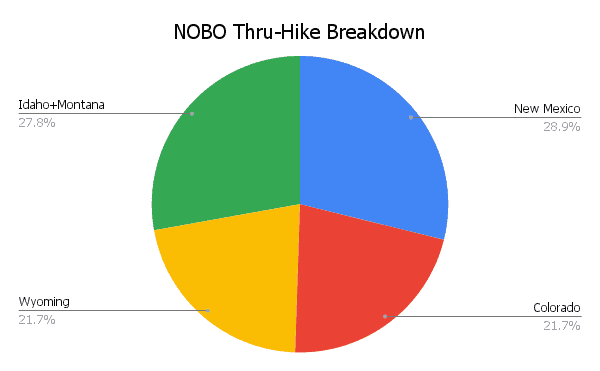
The Continental Divide Trail is generally considered to have five sections: New Mexico, Colorado, Wyoming, Idaho/Southern Montana, and Northern Montana. Because the CDT can get a bit crazy when it comes to alternates (especially the Anaconda Route or Big Sky/Super Butte Cutoff in Montana), I’ve divided the following data into New Mexico, Colorado, Wyoming, and Idaho+Montana.
In this section, we look at how long thru-hikers took for each section of the trail, a breakdown of hike lengths and averages, and a look at how many days hikers took off (zero/nearo days).
NOBO Average Days/Section
- 39 – New Mexico
- 30 – Colorado
- 30 – Wyoming
- 38 – Idaho+Montana
- 150 (NOBO-1) – Entire CDT
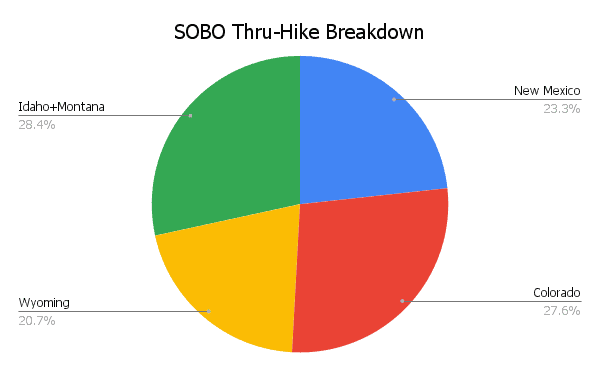
SOBO Average Days/Section
- 32 – New Mexico
- 38 – Colorado
- 29 – Wyoming
- 39 – Idaho+Montana
- 132 (SOBO-1) – Entire CDT
Length of Thru-hikes
THRU-1
143
The average number of days of an entire thru-hike
(M = 144 | σ = 23)
THRU-1
126
The average number of days hiking (total minus zero days)
(M = 125 | σ = 20)
THRU-1
23 mi
The average daily mileage (37 km)
(σ = 4 mi / 6.4 km)
THRU-1
26 mi
The average daily mileage after removing zero days (41.8 km)
(σ = 4 mi / 6.4 km)
THRU-1
41.5 mi
The average longest day of hiking (66.8 km)
(M = 38 | σ = 11 mi / 17.7 km)
Zero and Nearo Days (i.e. days off)
THRU-1
18
The average number of zero days (days off from hiking)
(M = 17 | σ = 10)
THRU-1
14
The average number of nearo days (low mileage days)
(M = 12 | σ = 11)
THRU-1
5
The average longest consecutive number of zero days
(M = 3 | σ = 3)
Completion Rates & Finish Location
As some of you may have already deduced at the mention of the fact there are multiple locations at both the Mexican and Canadian borders where Continental Divide Trail hikers begin their hikes, it follows that there are also multiple locations where hikers can end their hikes.
Here, we’ll take a look at where northbound hikers finished, where southbound hikers finished, and what percentage of hikers completed their hikes (in either direction).
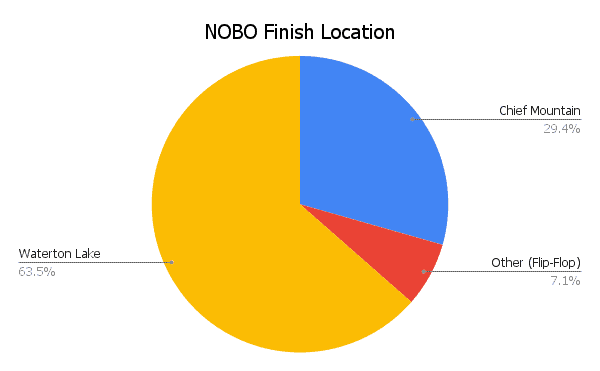
NOBO Finish Location
- 63.5% Waterton Lake
- 29.4% Chief Mountain
- 7.1% Other (Flip-Flop)
SOBO Finish Location
- 96.6% Crazy Cook
- 1.7% Columbus
- 1.7% Other (Flip-Flop)

CDT Completion Rates
Most people begin a Continental Divide Trail thru-hike intending to complete the trail. Unfortunately, not everyone who sets out on this most epic adventure of border-to-border glory completes the trail. Every year a large percentage of people hoping to hike the CDT will fail to complete the trail.
We’re going to look at completion rates, but we are doing so with a caveat. Since I distribute this survey myself, and because it is not required of CDT hikers, survey respondents are a self-selecting group who (likely) skew toward having completed the trail. A hiker who quit during their first week of hiking in April is probably paying little attention and caring far less about the Continental Divide Trail survey when it’s released in the fall.
THRU
80%
The percentage of thru-hiker respondents who completed the CDT.
NOBO
78%
The percentage of northbound thru-hiker respondents who completed the CDT.
SOBO
83%
The percentage of southbound thru-hiker respondents who completed the CDT.
Flip-Flopping & Footpaths
Flip-flopping is when a hiker skips a section of the trail (the flip) intending to come back to hike it later (the flop). This can happen because a hiker wants to avoid snow, skip a fire closure, or because of some other logistical issue. The flip-flop usually takes one of two forms.
One is a hiker skipping ahead, continuing to hike the same direction, and then returning to the point they originally departed the trail to hike the skipped section later (e.g. a northbound hiker skips from the NM/CO border to the CO/WY border, then hikes north to Canada before returning to the NM/CO border to hike north to the CO/WY border).
It can also be when a hiker skips ahead and then hikes the skipped section in the opposite direction of their original hike before jumping back up to the point where they originally skipped to and continuing their hike in the original direction (e.g. northbound hiker jumps from NM/CO border to CO/WY border and then hikes south to NM/CO border before returning to CO/WY border to continue hiking north).
Some hikers get wild with their flip-flopping; I recommend avoiding it altogether, if possible.
Here is what flip-flopping on the CDT looked like in 2021.
Did hikers flip-flop?
THRU 12% Yes
THRU 88% No
NOBO 17% Yes
NOBO 83% No
SOBO 4% Yes
SOBO 96% No

Why did hikers flip-flop?
- 54.5% Snow
- 22.7% Personal/Logistical
- 9.1% Injury
- 4.5% Fires
- 4.5% To meet/stay with a friend/hiking partner
- 4.5% Glacier permits

Where did hikers flip from/to?
I’ve struggled with how to best convey this information in the base, but here’s my attempt at it this year. The one thing I may do in the future is separate northbound and southbound flips or somehow try to incorporate the reasons into this (another?) chart. Open to suggestions.

It may sound straightforward enough, “Did you complete the CDT? Yes or no?” – but what constitutes a completed thru-hike isn’t necessarily the same for everyone.
Some people insist you need to have unbroken steps between Mexico and Canada along the official Continental Divide Trail to constitute a thru-hike while others may forgive skipping a road walk, hitchhiking around a fire closure, or taking alternates (or shortcuts).
To get a better idea of how much of the trail this year’s finishers hiked, I asked about their footsteps between the terminuses.
Did hikers complete a continuous and unbroken footpath between Mexico and Canada?
- 63% – Yes, and I road walked around any fire closures
- 21.9% Mostly, but I may have missed a few miles
- 8.9% No, I skipped or hitched past small sections of trail
- 6.2% Yes, but I skipped the fire closures

Alternate Routes
The Continental Divide Trail is more well-defined than many suspect, but there are loads of alternate trails (sometimes known as “shortcuts”) hikers can take either instead of or in addition to the official CDT. I ask about these alternates to get an idea of what the most common CDT thru-hikes looked like. Alternates are listed in geographical order from south to north.
The following colors indicate the popularity of each alternate (the percentage of hikers who took each): OVER 75%, 50-75%, 25-50%, UNDER 25%.
NEW MEXICO ALTERNATES
- Columbus Alternate: 0.6%
- Walnut Creek Alternate: 1%
- Gila River Alternate: 95%
- Gila River High Route Alternate: 32%
- Pie Town Alternate via Mangas Mountain: 54%
- Cebolla Wilderness Alternate: 42%
- Bonita-Zuni Alternate: 39%
- Mount Taylor Alternate: 56%
- Ghost Ranch Alternate: 55%
COLORADO ALTERNATES
- Great Divide Alternate: 19%
- Elwood Pass 13%
- Creede Cutoff: 34%
- Mirror Lake Alternate: 9%
- Collegiate East: 8%
- Twin Lakes Cutoff: 34%
- Mount Elbert: 26%
- Silverthorne Alternate: 24%
- Montezuma Alternate: 4%
- Argentine Spine: 17%
- Rocky Mountain National Park Shortcut: 46%
WYOMING ALTERNATES
- Ley Alternate south of Rawlins: 31%
- Wind River High Route: 2%
- Cirque of the Towers: 86%
- Knapsack Col: 62%
- Leeds Creek: 7%
- Teton Crest Trail: 2%
IDAHO/MONTANA ALTERNATES
- Mack’s Inn Alternate: 13%
- Super Butte Cutoff: 60%
- Anaconda Cutoff: 20%
- Butte Connector: 5%
- Spotted Bear Pass: 60%
- Ptarmigan Tunnel: 0.6%
- Chief Mountain: 57%
“Ley Alternate” refers to an alternate route on the Ley Maps – maps produced by CDT hiker Jonathan Ley. More on the Ley Maps here.
Hiker Challenges
I ask hikers which sections of the CDT they found to be the most difficult and which they found to be the easiest. Next year, I plan on expanding this question to get a more specific idea of where hikers find the trail to be most and least challenging.
I’ve also asked hikers to rate some of the challenges they faced on the trail on a scale of 1 to 10. This includes snow, stream crossings, mosquitoes, elevation, rain/hail, storms/lightning, wind, rodents, cold, heat, smoke/fires, and (this year) COVID.
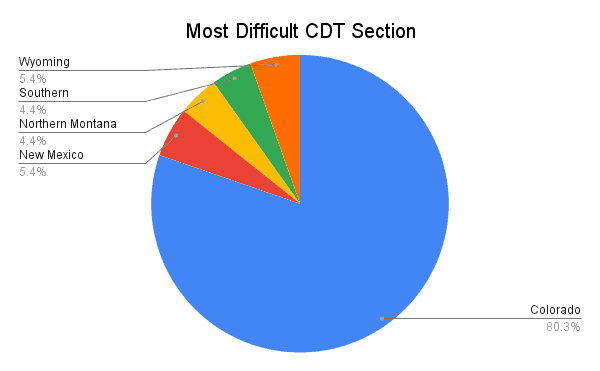
Most Difficult Section
- 80.3% Colorado
- 5.4% Wyoming
- 5.4% New Mexico
- 4.4% Idaho/Southern Montana
- 4.4% Northern Montana
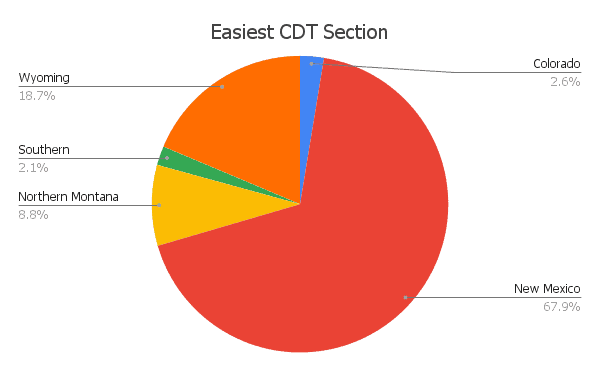
Easiest Section
- 67.9% New Mexico
- 18.7% Wyoming
- 8.8% Northern Montana
- 2.6% Colorado
- 2.1% Idaho/Southern Montana
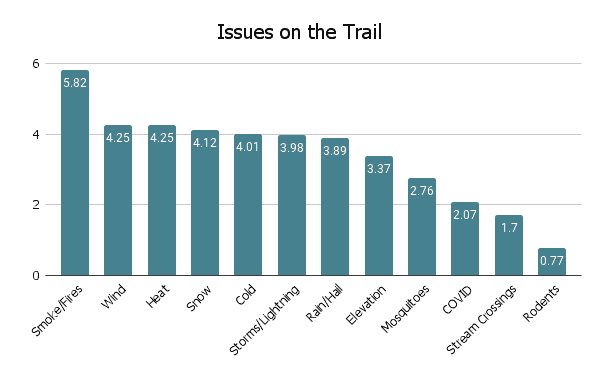
On-Trail Issues
I asked hikers, on a scale of 1 to 10, how much of an issue each of the following was during their hikes.
- 5.82 Smoke/Fire
- 4.25 Heat
- 4.25 Wind
- 4.12 Snow
- 4.01 Cold
- 3.98 Storms/Lightning
- 3.89 Rain/Hail
- 3.37 Elevation
- 2.76 Mosquitoes
- 1.7 Stream Crossings
- 0.77 Rodents
Why Hikers Didn’t Finish
In case you were left wondering what happened to the hikers who didn’t complete the CDT this year when we covered completion rates above, fear not. Here we look at the specifics as to why hikers didn’t complete the Continental Divide Trail this year.
Why Hikers Got off the Trail
- 38.2% Injury
- 26.5% Personal
- 8.8% Illness
- 8.8% Financial
- 5.9% Family
- 2.9% Fires
- 2.9% Health
- 2.9% School
- 2.9% Work

Hike-ending injuries and where they occurred
Injury is a big killer of thru-hikes and is typically something hikers can exercise some control over. Here, we break down what kinds of injuries ended hikes and where these hike-ending injuries occurred.
Hike-Ending injuries
- 25% Overuse injury (leg)
- 16.7% Stress fracture (foot)
- 8.3% Overuse injury (foot)
- 8.3% Tooth issue
- 41.7% Undisclosed
Where injuries occurred
- 25% New Mexico
- 41.7% Colorado
- 16.7% Wyoming
- 16.7% Idaho/Southern Montana
- 0% Northern Montana

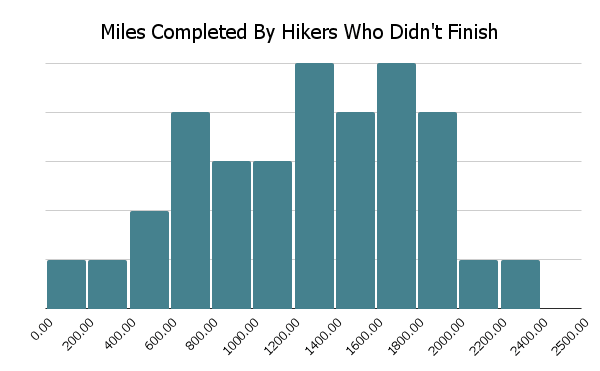
Miles completed by hikers who didn’t finish the CDT
- 8.8% – < 500 mi / 805 km
- 23.5% – 500 to 1,000 mi / 805 to 1,609 km
- 26.5% – 1000 to 1,500 mi / 1,609 to 2,414 km
- 32.4% – 1500 to 2,000 mi / 2,414 to 4,023 km
- 5.9% – > 2,000 mi / 4,023 km
Average: 1,243 mi / 2,000 km
Median: 1,267 mi / 2,039 km
σ = 520 mi / 837 km
Resupply
The word “resupply” can be anxiety-inducing if you’re new to the idea of long-distance thru-hiking. What is resupply? Where does it come from? How much of it is there? How do you get it? Will it hurt?
Resupply is getting yourself more food to power more hiking. It need not be scary or intimidating. Resupply on a Continental Divide Trail has become more simple over the years, but when and where hikers resupply is still a question that many find overwhelming.
Here we have this year’s resupply stats, resupply strategy/boxes, resupply box suggestions, hitchhiking difficulties, where hikers resupplied, favorite and least favorite resupply stops, favorite meals and snacks, and resupply advice.
CDT Resupply Stats
THRU-1
29.7
The average number of resupplies over the entire trail
(M = 29 | σ = 3.7)
THRU-1
5
The average number of days between resupplies
(M = 5 | σ = 1)
THRU-1
108
The average number of miles between resupplies (174 km)
(M = 109 mi / 175 km | σ = 13.5 mi / 21.7 km)
THRU
4.8
The average number of resupply boxes prepared ahead of time
(M = 3 | σ = 6)
THRU-1
6.1
The average total number of resupply boxes sent
(M = 5 | σ = 5.7)
THRU-1
19%
The average percent of resupplies sent as boxes
(M = 10% | σ = 21%)
Thru-Hiker Resupply Strategy
- 2.2% Mailed ALL resupplies
- 9.4% Mailed MOST resupplies (> 50%)
- 54.4% Mailed SOME resupplies (10-50%)
- 25% Mailed A FEW resupplies (1-10%)
- 8.9% Mailed NO resupplies

Most hikers concern themselves a lot about resupply but remember that you can mail yourself boxes from on the trail. You do not have to have ALL your resupply boxes prepared ahead of time. Many towns have supermarkets (and post offices).
That said, it can be helpful (and oftentimes time-saving) to mail yourself resupply boxes. Hikers may choose this option because of a resupply stop’s limited food selection, dietary restrictions, high prices, or even the owners of the local resupply establishment being awful people.
Something else to consider when thinking about resupply is the fact that many towns along the CDT are only accessible via car (or ludicrously long, dangerous, and ill-advised road walks). How do you get to these towns? Most hikers elect to hitchhike.
Here are the places hikers say they recommend sending a resupply box and where they had difficulty hitchhiking to/from.
Suggest Mailing Resupply
- Pie Town (New Mexico) 76%
- Doc Campbell’s (New Mexico) 43%
- Encampment/Battle Pass (Wyoming) 29%
- East Glacier Village (Montana) 24%
- Benchmark Wilderness Ranch (Montana) 23%
- Old Faithful Village/Yellowstone (Wyoming) 22%
- Ghost Ranch (New Mexico) 18%
- Twin Lakes (Colorado) 15%
- Leadore/Bannock Pass (Idaho) 11%
- Lima (Idaho) 11%

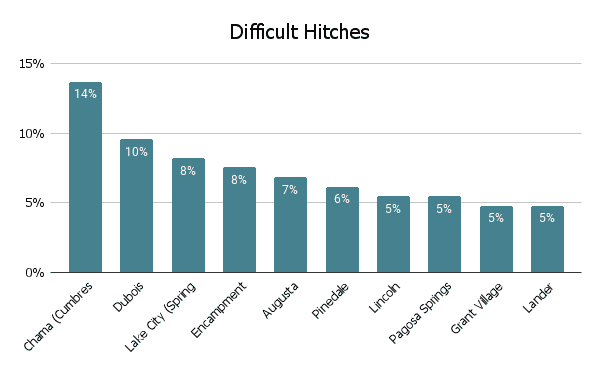
Difficult Hitches
- Chama via Cumbres Pass (New Mexico) 14%
- Dubois via Togwotee Pass (Wyoming) 10%
- Lake City via Spring Creek Pass (Colorado) 8%
- Encampment via Battle Pass (Wyoming) 8%
- Augusta (Montana) 7%
- Pinedale (Wyoming) 6%
- Lincoln (Montana) 5%
- Pagosa Springs via Wolf Creek Pass (Colorado) 5%
- Grant Village (Wyoming) 5%
- Lander (Wyoming) 5%
Where Hikers Resupplied
I ask hikers to report on where they resupplied – not where they stopped/passed through, but where they actually purchased, picked up, were given, or otherwise came into a new stock of food. For example, the trail passes through the middle of Silver City; theoretically, all thru-hikers who complete the trail will go there, but not all thru-hikers resupply there. Make sense? I hope so. If you’re struggling with this, you’ll have issues on the trail.
Locations are listed in geographical order from Mexico to Canada (that’s south to north) and, again, I use the following colors to indicate each resupply stop’s popularity: OVER 75%, 50-75%, 25-50%, LESS THAN 25%.
*Denotes stops where this year’s class suggests sending resupply boxes to
NEW MEXICO RESUPPLY
- Lordsburg (95%)
- Columbus (0%)
- Deming (0.6%)
- Silver City (94%)
- Doc Campbell’s (94%)*
- Truth or Consequences (0.6%)
- Reserve (7%)
- Davila Ranch (1%)
- Pie Town (92%)*
- Quemado (2%)
- Grants (94%)
- Albuquerque (6%)
- Cuba (91%)
- Santa Fe (13%)
- Ghost Ranch (22%)*
- Abiquiu (3%)
- Taos (4%)
- Chama via Cumbres Pass (94%)
COLORADO RESUPPLY
- Pagosa Springs via Wolf Creek Pass (77%)
- South Fork via Wolf Creek Pass (11%)
- Platoro (8%)
- Del Norte (7%)
- Creede (37%)
- Silverton via Stony Pass (23%)
- Durango (4%)
- Lake City via Spring Creek Pass (49%)
- Monarch Mountain Lodge via Monarch Pass (14%)
- Salida via Monarch Pass (83%)
- Buena Vista (10%)
- Twin Lakes (67%)*
- Leadville (62%)
- Copper Mountain (11%)
- Breckenridge (32%)
- Frisco (29%)
- Silverthorne (20%)
- Dillon (21%)
- Idaho Springs (1%)
- Winter Park (33%)
- Fraser (9%)
- Denver (10%)
- Grand Lake (85%)
- Steamboat Springs via Rabbit Ears Pass (94%)
WYOMING RESUPPLY
- Encampment via Battle Pass (45%)*
- Riverside via Battle Pass (14%)
- Rawlins (97%)
- South Pass City (19%)
- Atlantic City (14%)
- Lander (75%)
- Pinedale (63%)
- Lava Mountain Lodge via Togwotee Pass (0%)
- Dubois via Togwotee Pass (68%)
- Jackson via Togwotee Pass (22%)
- Brooks Lake Lodge (12%)
- Cody (7%)
- Grant Village in Yellowstone (26%)
- Old Faithful Village in Yellowstone (59%)
- Mammoth Village in Yellowstone (17%)
IDAHO/MONTANA RESUPPLY
- West Yellowstone (19%)
- Island Park / Mack’s Inn (8%)
- Big Sky (11%)
- Ennis (3%)
- Lima (18%)*
- Leadore via Bannock Pass (15%)*
- Tendoy (1%)
- Salmon (5%)
- Jackson (7%)
- Darby via Lost Trail Pass (7%)
- Hamilton via Lost Trail Pass (1%)
- Wisdom (8%)
- Wise River (2%)
- Anaconda (23%)
- Whitehall (3%)
- Butte (66%)
- Bozeman (26%)
- Helena (87%)
- Elliston (4%)
- Lincoln (68%)
- Benchmark Wilderness Ranch (27%)*
- Augusta (56%)
- East Glacier Village (95%)
- Kalispell (2%)
- Two Medicine (17%)
- St Mary (0%)
- Many Glacier (32%)
- West Glacier (0%)
There’s some strangeness that went on with the Idaho/Southern Montana resupply locations that I will attempt to address in the future. This has come about because of the number of people taking alternates/cutoffs around the Wyoming-Idaho-Montana border area.
Favorite & Least Favorite Resupply Stops
Now we know the most popular stops for resupplying and for sending resupply boxes, but what about hikers’ favorite and least favorite resupply stops? When asking this question I specify “‘Favorite/Least Favorite’ means where you most/least enjoyed, not where had the best/worst resupply options (although these could be the same).”
FAVORITE RESUPPLY STOP
Silver City, NM
LEAST FAVORITE RESUPPLY STOP
Cuba, NM
FAVORITE RESUPPLY STOPS
- New Mexico: Silver City (40%)
- Colorado: Leadville (26%)
- Wyoming: Lander (31%)
- Idaho/Montana: Helena (19%)
RUNNERS-UP
- New Mexico: Doc Campbell’s (20%)
- Colorado: Salida (25%)
- Wyoming: Pinedale (22%)
- Idaho/Montana: East Glacier Village (16%)
LEAST FAVORITE RESUPPLY STOPS
- New Mexico: Cuba (29%)
- Colorado: Grand Lake (8%)
- Wyoming: Encampment (15%)
- Idaho/Montana: Leadore (12%)
RUNNERS-UP
- New Mexico: Lordsburg (28%)
- Colorado: Breckenridge (7%)
- Wyoming: Rawlins (13%)
- Idaho/Montana: East Glacier Village (11%)
Favorite Meals & Snacks
For the final piece of the resupply puzzle, we look at which meals and backpacking snacks hikers enjoyed most out on the CDT. More on this to come in the CDT Resupply Guide. Next year, I’ll be adding questions to cover hiker dietary restrictions and how easy they found resupplying with these restrictions.
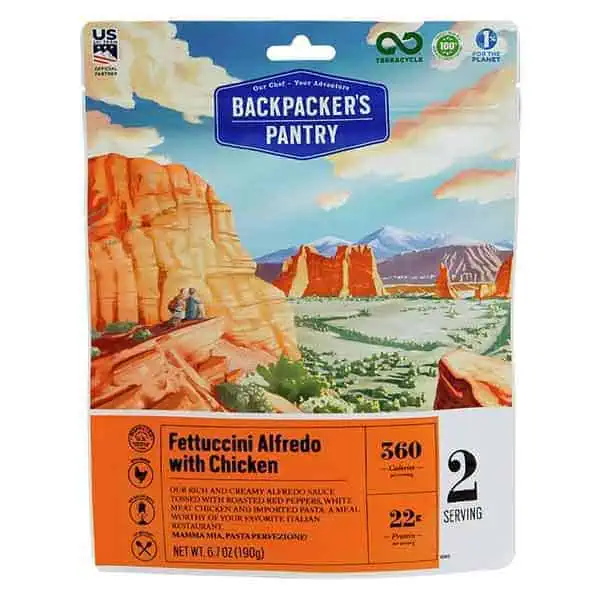
Favorite Backpacking Meals
- Backpacker’s Pantry 17%
- Mountain House 15%
- Knorr Rice Sides 14%
- Good To-Go 10%
- Peak Refuel 8%
Favorite Backpacking Snacks
- M&M’s 24%
- Snickers Bars 23%
- Potato Chips 21%
- Honey Stinger Waffles 18%
- Pop-Tarts 14%
- Bobo’s Oat Bars 12%
- Larabars 12%
- Beef Jerky 12%
- Almonds 11%
- Peanut Butter 11%

Resupply Changes
Hindsight is 20/20 (unless you’re looking back through the darkness for that mountain lion you think might be following you – but that’s likely a deer). Here is what hikers said they would change about their resupply strategies if they had the chance to do it all over again. These don’t change much from year to year, so I would highly encourage you to heed this advice when considering your resupply options.
67% of hikers say that they would have made changes to their resupply strategy. Here are the most popular changes hikers would have made to their CDT resupply.
- Send MORE VARIETY in boxes (31%)
- Send HEALTHIER FOOD in boxes (30%)
- Send FEWER resupply boxes* (26%)
- Send boxes from ON TRAIL instead of ahead of time (21%)
- Send LESS FOOD in boxes (18%)
*The average number of boxes sent by hikers who said they would have liked to have sent FEWER boxes was 9. The average was 6.
THRU
11%
The number of thru-hikers who went stoveless for the entirety of their hikes.
I’ll be following up this post with a more detailed breakdown of this year’s resupply. If you would like to be notified of new posts, click here. Find all CDT Resupply posts here.
Thru-hiking Gear
Potentially what Continental Divide Trail hikers spend the most time obsessing over before (and on…and after) the trail is their thru-hiking gear. Gear choices play an essential role in a thru-hike, but there is no magical gear combination that will guarantee you a successful thru-hike (if you know otherwise, please let me know).
I do a deep dive into gear used by CDT hikers in my CDT Gear Guide, but here’s a taste of what to expect. Let’s take a look at what this year’s CDT Class had with them out on the trail.
THRU-1
15.74 lbs
Average pre-hike base weight (7.14 kg)
(M = 15 lbs / 6.8 kg | σ = 6.18 lbs / 2.8 kg)
THRU-1
14.89 lbs
Average post-hike base weight (6.75 kg)
(M = 14 lbs / 6.8 kg | σ = 5.32 lbs / 2.13 kg)
THRU-1
-1.17 lbs
Average total change in base weight (531 g)
(M = 0)
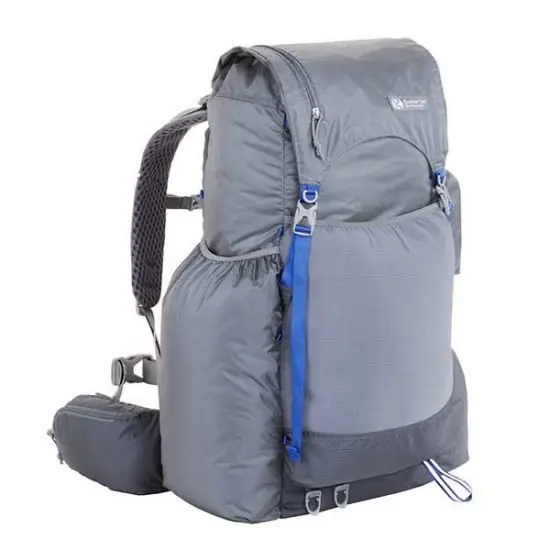
THRU
52.6 L
Average backpack size
(M = 55)
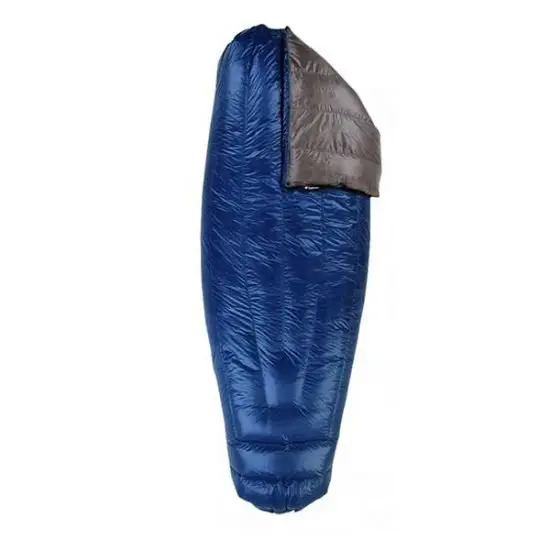
THRU
15.7°F
Average sleeping bag rating (-9.1°C)
(M = 15°F / -9.4°C)
THRU-1
4.59
Average total number of shoes used
(M = 5)
There are more detailed and more interesting breakdowns of this information on the way in this year’s CDT Gear Guide. For now, let’s take a peek at some of the gear thru-hikers were using on the trail this year. Here are the most common “Big 4” items: packs, shelters, sleeping bags, and sleeping pads (I know it’s the “Big 3”, but I include sleeping pads, get over it) along with the most common insulated jackets and shells.
Again, there will be extensive breakdowns in the CDT Gear Guide.
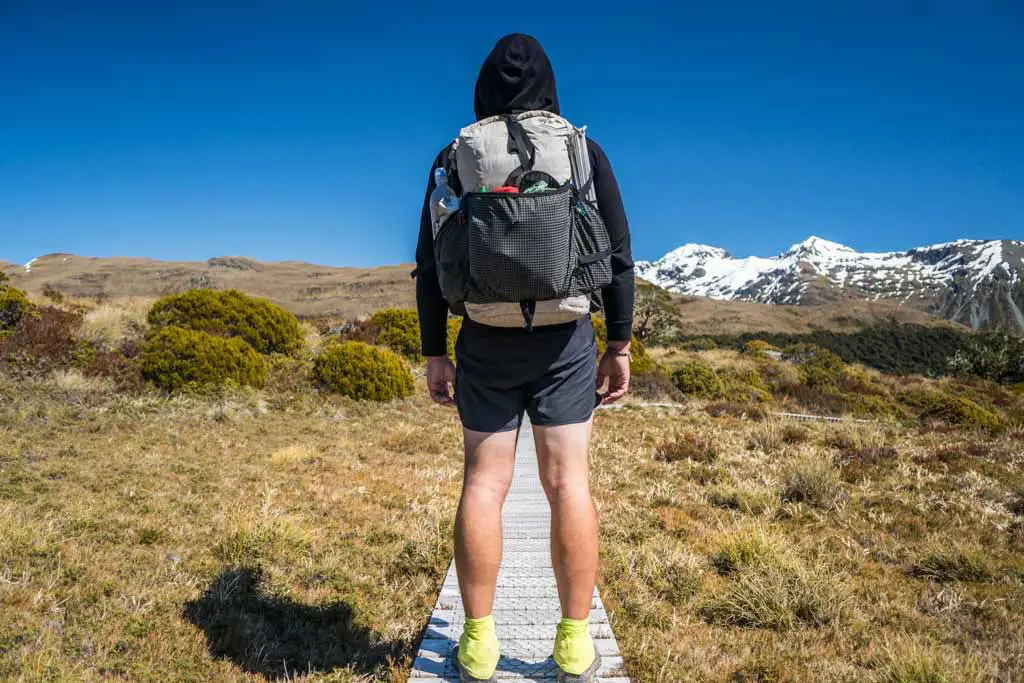
Most Common CDT Backpacks
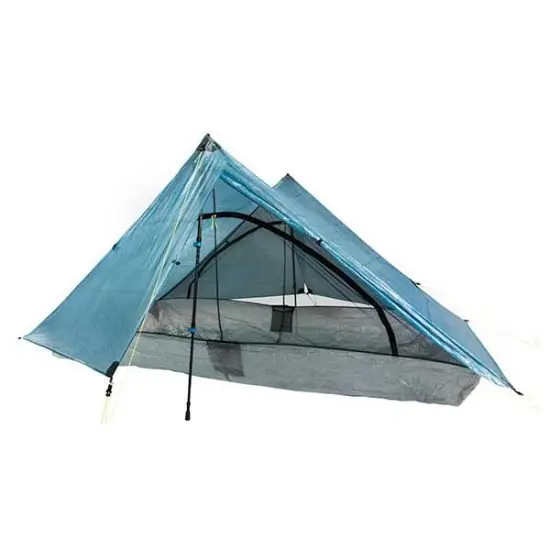
Most Common CDT Shelters
Most Common CDT Sleeping Bags/Quilts
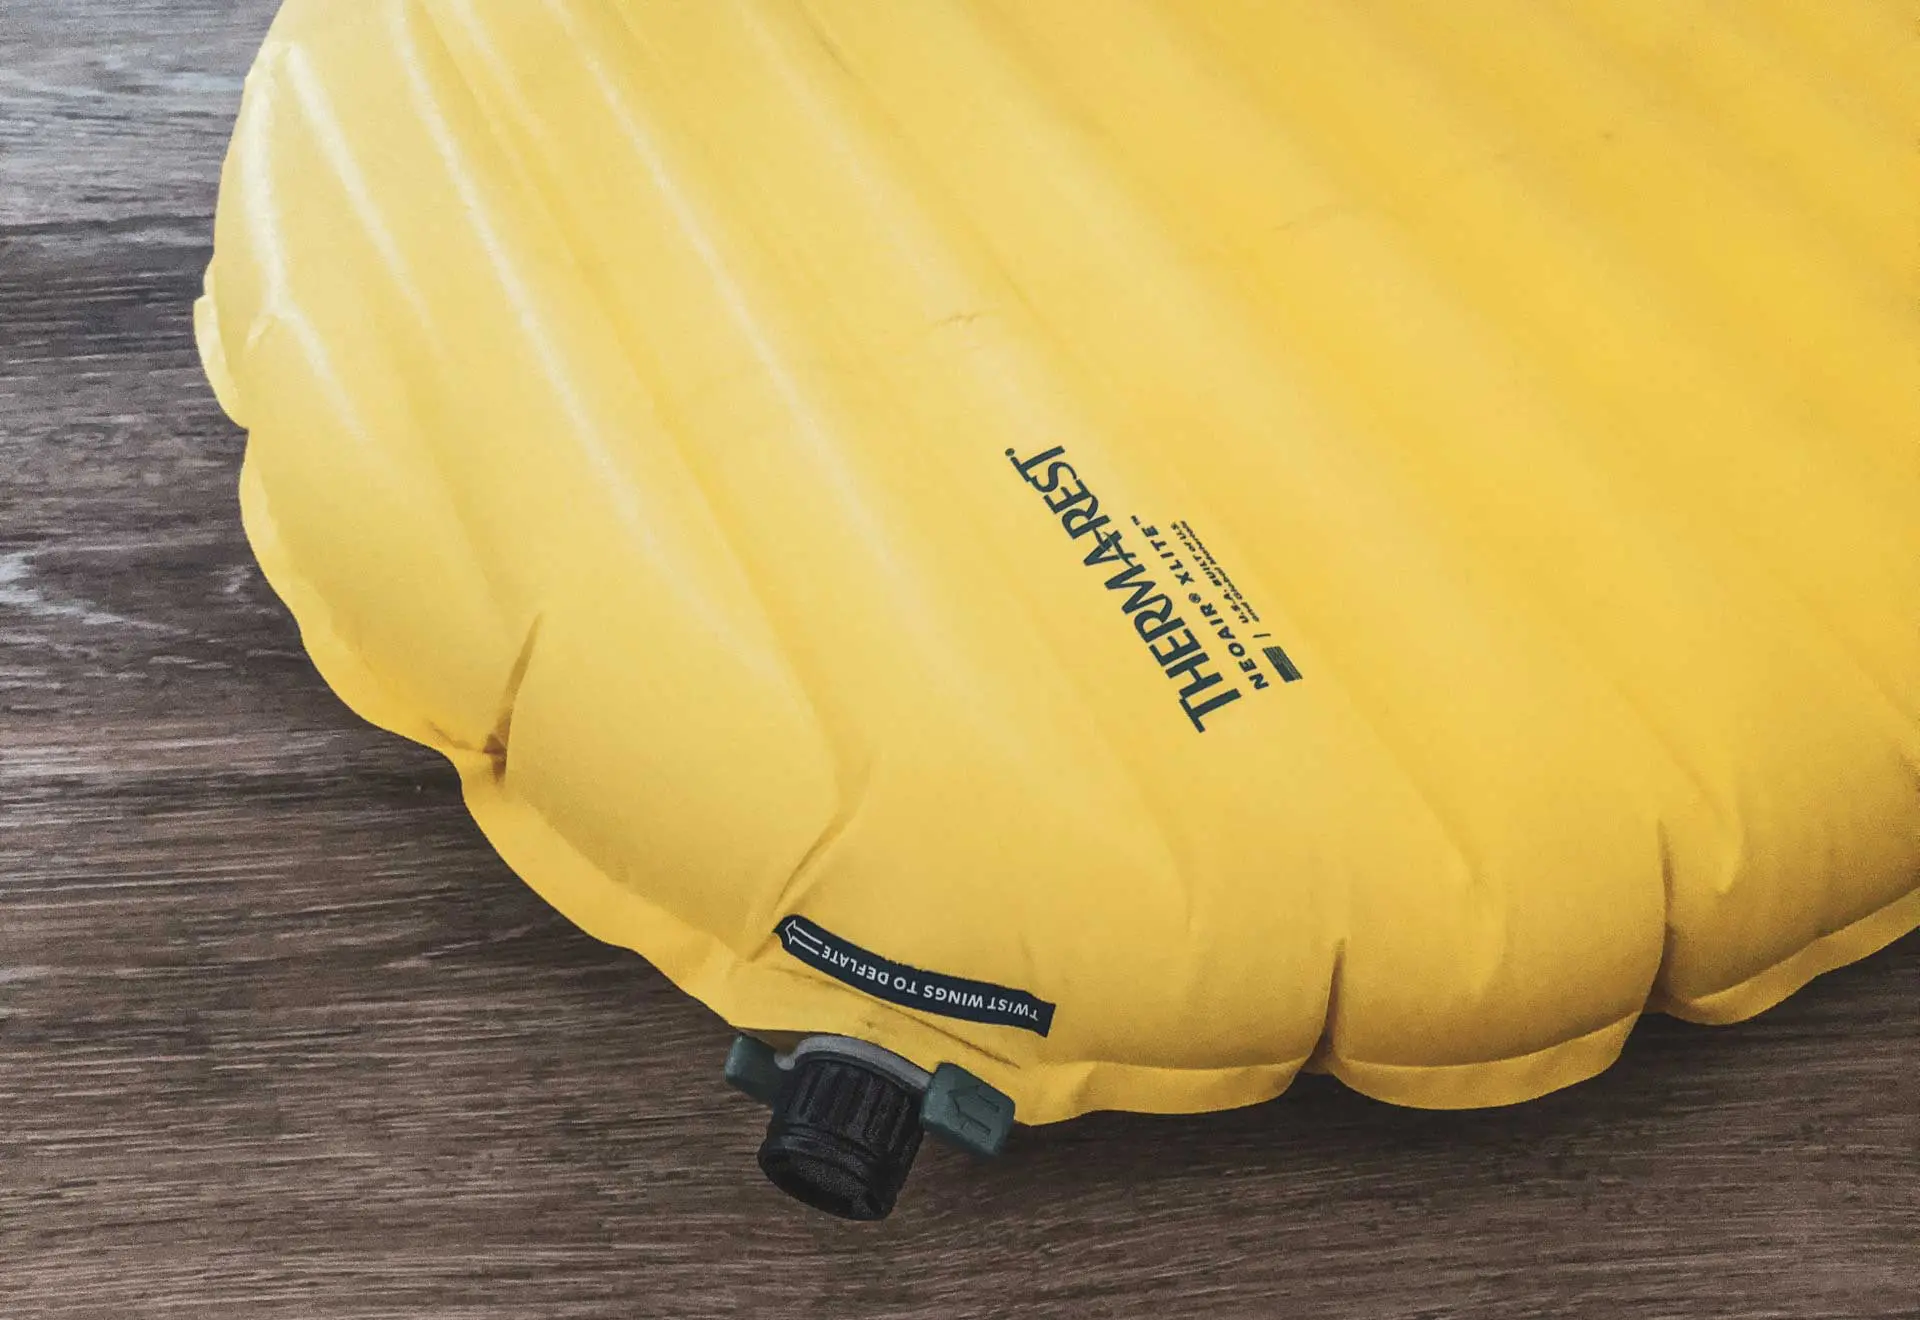
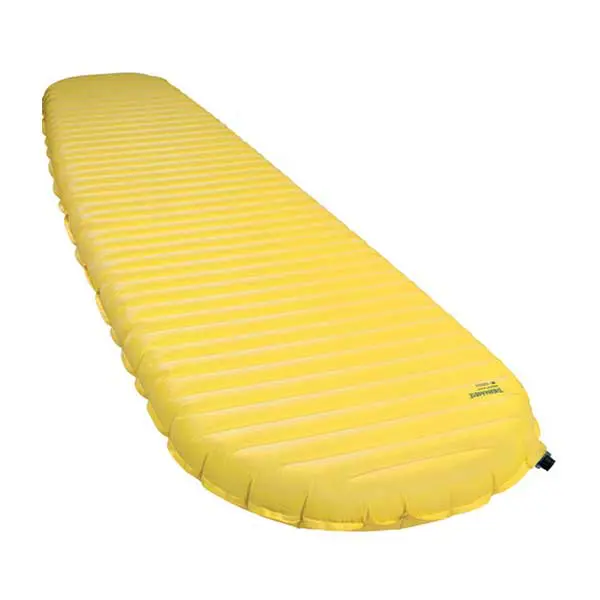
Most Common CDT Sleeping Pads
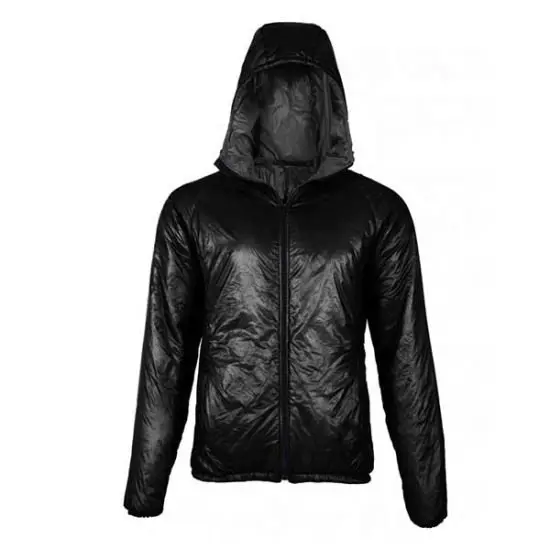
Most Common CDT Insulated Jackets
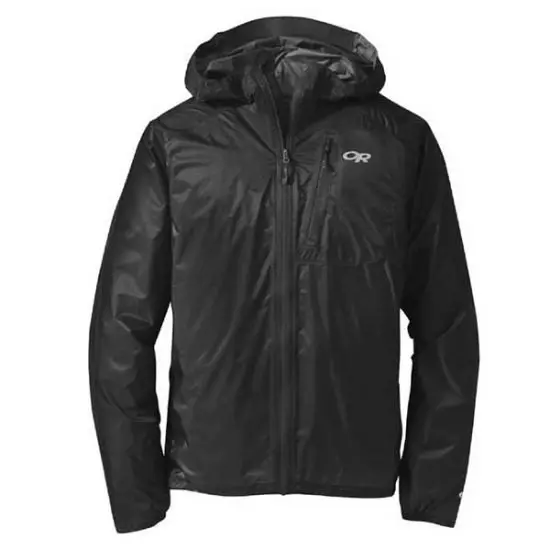
Most Common CDT Shells
This is just the tip of the proverbial thru-hiking gear iceberg. As mentioned above, I will be publishing a detailed breakdown of this year’s CDT gear. This will include (in addition to everything above) water treatment, stoves, fleeces, snow gear, PLBs, additional gear, luxury items, what hikers didn’t like about their gear, what gear decisions (might have) helped hikers to a successful thru-hike, how hikers would change/adapt their gear for a future hike, and more.
Technology on Trail
Gone are the days of Continental Divide Trail old when it was a trail sought out by only uber-experienced backcountry orienteers; thanks to the magic of technology, any dodo can grab a phone and have a reasonably good chance of not killing themselves on the trail.
Phones are everywhere on the trail. If the sight of a cellular device in the wilderness distresses you, then prepare yourself. Phones are hikers’ cameras, GPS devices, televisions, music players, town-researching devices, and (sometimes) SOS devices (that said, I suggest a Garmin inReach Mini if you’re looking for an SOS device).
There are several apps commonly used by Continental Divide Trail hikers – and even one designed specifically for the CDT (that you should most certainly invest in). Here are the apps and phones hikers were using out on the trail this year.
CDT Hiker Phones
- 61.4% iPhone
- 38.1% Android
- 0.5% Didn’t carry a phone

CDT Hiker Apps
- 93.5% FarOut Guides (formerly Guthook)
- 65.9% Gaia
- 56.1% Avenza Maps
- 15.9% CalTopo
- 7.9% PeakFinder
- 5.1% Strava

Hiker Health & Water Sources
Water treatment and personal hygiene are (or should be) big considerations for hikers. Typically thru-hikers worry less about these as the trail goes on; experience isn’t always your friend.
Some hikers religiously filter all water that passes through their face hole – it doesn’t matter if it comes out of a hotel sink or a puddle with a cow pooping in it. Other hikers will “not filter above 10,000 ft / 3,048 m” or “not filter running water” (this last one is not a good idea – running water can 100% get you sick).
Everyone wants to look cool in front of their friends by not filtering water (note: not filtering your water does not make you cool), but there are risks to the badass thru-hiker lifestyle (and to drinking dirty, giardia-infested water).
To find out how good a job everyone is doing filtering their water and sanitizing their hands after pooping (another way to get yourself sick), I ask hikers if they got sick (defined as three or more days of digestive issues or diagnosed giardia), how often they treated water sources, and how these two things compare to one another.
CDT Hiker Illness
- 91.6% Didn’t get sick
- 8.4% Got sick

Water Treatment Frequency
- 67.8% Always
- 23.4% Usually
- 8.4% Sometimes
- 0.5% Never

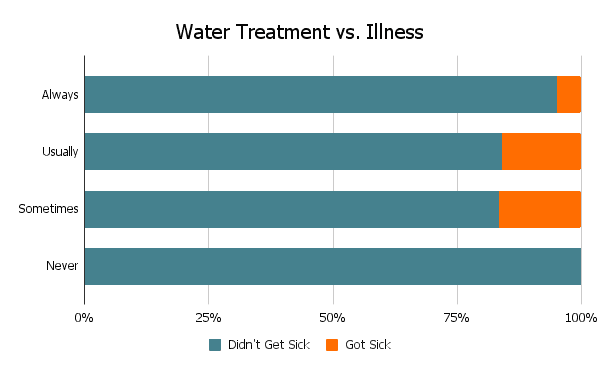
CDT Water Treatment
- 3.3% Always treated, got sick
- 64.5% Always treated, never got sick
- 3.7% Usually treated, got sick
- 19.6% Usually treated, never got sick
- 1.4% Sometimes treated, got sick
- 7% Sometimes treated, never got sick
- 0% Never treated, got sick
- 0.5% Never treated, never got sick

Looking at this another way, we can see the following.
- 67.8% of hikers always treated their water and 5.1% of these hikers got sick
- 23.5% of hikers usually treated their water and 19.1% of these hikers got sick
- 8.5% of hikers sometimes treated their water and 20% of these hikers got sick
- 0.5% of hikers never treated their water and 0% of these hikers got sick
In total, a reported 8.4% of hikers came down with something akin to giardia, and 0.5% never filtered. That said, those who don’t filter are typically quite staunch in their commitment to their strategy; read: don’t readily admit to becoming sick from not filtering.
Favorite/Least Favorite Sections
This may come as a shock, but the Continental Divide Trail is a long hike with a lot to see (mostly bears). Here is a look at the favorite and least favorite sections of the trail.
Favorite CDT Section
- Northern Montana
- Wyoming
- Colorado
- New Mexico
- Idaho/Southern Montana

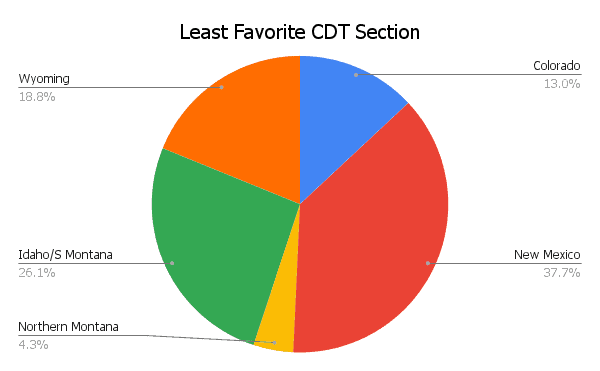
Least Favorite CDT Section
- New Mexico
- Idaho/Southern Montana
- Wyoming
- Colorado
- Northern Montana
FAVORITE SECTION
Wind River Range
Wyoming (88%)
LEAST FAVORITE SECTION
Great Divide Basin
Wyoming (48%)
FAVORITES
- NEW MEXICO: Gila River Alternate (54%)
- COLORADO: San Juan Mountains (46%)
- WYOMING: Wind River Range (88%)
- IDAHO/MONTANA: Glacier National Park (82%)
LEAST FAVORITES
- NEW MEXICO: Pie Town to Grants (40%)
- COLORADO: Rocky Mountain National Park (8%)
- WYOMING: Great Divide Basin (48%)
- IDAHO/MONTANA: Idaho/Montana Border (15%)


Best & Worst Moments
I will be sharing more of these in a future post, but for now, here are some examples that stood out when I asked hikers about their best moments, worst moments, and terrifying moments from their thru-hikes.
Best CDT Moments
- We hiked in a thunderstorm in North Yellowstone and came upon a wolf on the trail in front of us. We stopped and watched as it got off the trail and walked around us rejoining the trail behind us. There was a moment when it passed that it stopped and turned its head to the side to keep tabs on us, and I locked eyes with it. For those few seconds I forgot I was in a storm. I forgot I was muddy and bleeding and exhausted. I was just chillin’ with a wolf in a thunderstorm.
- Hiking into Ghost Ranch, and descending off the Colorado Plateau. This was my first “real” desert hiking experience. Seeing cacti for the first time, the amazing rocks – I was in irrationally good spirits (it was very hot) but I was finally doing it.
- In the Winds, I finally started hiking with a group that became my trail family. So many great moments with them, but the best had to be hanging out at the top of passes in Glacier National Park. That place is amazing.
- Probably the entire Wind River High Route – particularly walking across the Gannett and Grasshopper Glaciers.
Worst CDT Moments
- After getting to and safely down from the Gray to Edwards traverse. I was exhausted and frankly traumatized. It was so dangerous. I thought if Colorado was going to continue to be like this, I’m done.
- A day in the San Juans (Colorado) when a thunder blizzard forced me into an uncomfortable decision between a sketchy glissade or remaining on the ridge in extreme weather. After an intense glissade I set up my tent in a panic but everything was soaked in the process, leading to an extremely cold, wet, and unpleasant night. This was a physically dangerous day, and mentally and emotionally challenging as well.
- I spent most of Colorado trying to keep up with a group, including a friend I started the trail with, who were faster than me, and I burned myself out badly. Outside of Winter Park, it caught up to me and I had multiple panic attacks on trail and essentially had a breakdown. I had to separate from the people I was with and take some time off the trail to give myself the rest I had desperately needed for the prior month.
- Realizing after throwing up water for the third time that something was wrong and that if I couldn’t keep hydrated then I had to bail on my hike.
Scariest CDT Moments
- I happened upon a man and a woman digging in some dirt on the shoulder and they had their truck parked off the edge of a forest service road. Got major scary views as the man got up with a hammer in his hand. I got the fuck out of there asap.
- Accidentally got in between a mother grizzly and her cub in Wyoming.
- I was on the Big Sky Cutoff and getting closer to Butte. I was night hiking along the road and a local pulled up. He was pressuring me to come stay at his house and getting frustrated with me because he thought I was going to trespass on private land. I was actually just heading to a plot of BLM land I saw on the map connected to the road but he didn’t buy it. He drove back 10 minutes later and questioned me again. I didn’t end up staying where I had told him I was planning to stay safe.
- There were other hikers I didn’t trust and didn’t want to be alone in the woods with (though the vast majority of hikers seemed safe).
- All my gear was totally soaked through at 11,000 ft / 3,353 m in driving sleet after Hope Pass. I set up camp and wound up shivering hard in my sleeping bag all night. Not fun.
Discrimination
The Continental Divide Trail is, for the most part, an amazing place filled with incredible people. However, just as the trail itself can be not so amazing at times – thunderstorms, fires, cows and their poops – the people too, can occasionally be trash humans with no business representing the CDT or trail community.
This year, I asked hikers about discrimination experienced or witnessed on the trail. I already identified a better way to ask this question for next year’s survey and I am planning an additional post covering discrimination on the trail in more detail.
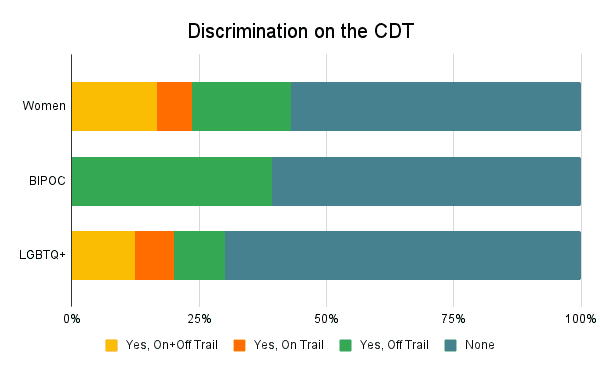
Sexism
Overall, 43.1% of female hikers experienced discrimination on the CDT. 6.9% experienced discrimination from other hikers, 19.4% from people in town, and 16.7% from both their fellow hikers and people in town.
Racism
Overall, 39.9% of BIPOC hikers experienced discrimination on the CDT. 0% experienced discrimination from other hikers, 39.9% from people in town, and 0% from both their fellow hikers and people in town.
Homophobia
Overall, 30% of LGBTQ+ hikers experienced discrimination on the CDT. 7.5% experienced discrimination from other hikers, 10% from people in town, and 12.5% from both their fellow hikers and people in town.
Trail Magic
Trail Magic Frequency
This year, I asked hikers about the frequency with which they encountered or received trail magic. This could mean a friendly person on the trail sharing some fresh fruit with them or a trail angel hanging out at a trailhead giving cold drinks and rides to hikers.
The scale was from 0 – never – to 10 – every day.
- 3.36 New Mexico
- 2.78 Colorado
- 2.03 Wyoming
- 1.74 Idaho/Southern Montana
- 2.23 Northern Montana

Advice for the Future
Now for Continental Divide Trail thru-hiker wisdom. I ask hikers what they would have done differently before their hikes if they were to do it all over again.
Pre-Hike Changes
- 22.8% – Gotten lighter gear
- 20.5% – Saved more money beforehand
- 19.1% – Trained more
- 12.6% – Had gear more dialed in
- 11.6% – Started earlier
THRU
19.38 lbs
The average base weight of hikers who said they would have liked to have gotten lighter gear before starting their hikes (8.791 kg)
In addition to asking hikers what they would have done differently before their thru-hikes, I asked them what they wish they had done differently during their hikes. Here are the top responses (regrets).
During Hike Changes
- 40.9% – Taken more photos of people
- 20.5% – Maintained a journal/blog
- 15.8% – Less time in town
- 15.4% – Fewer zero days
- 14.4% – Slowed down
THRU-1
25.3
The average number of zero days taken by hikers who said they wish they had taken fewer during their thru-hikes
Thru-hiker Advice
I ask hikers what advice for future CDT hikers they have. This will be thoroughly documented in the upcoming post CDT: Advice For The Future, here is a sample.
- Be very flexible. Make new friends. Adjust plans as necessary to stay safe – it’s a long trip. Don’t mail yourself a bunch of food way in advance – your appetites will change.
- Don’t commit yourself to doing anything other than finishing ahead of time. Don’t commit to doing the whole trail with one person or a group, don’t expect to do a certain number of miles per day or hike a particular speed, and don’t commit to any particular route. This trail will throw a heck of a lot at you, and the best way to make it through is to be flexible and to adapt as you experience it. Keeping yourself open to adapting is what will help you make it through.
- Save your money — expect lots of gear failures, expensive lodging, and expensive resupplies along the way.
- Make a plan and throw it out. The trail and your body will tell you your new plan, you just have to listen to it. Hike the trail for your own reasons and remember them, if the trip no longer fits your reasons it is okay to stop, I did and many do, just do what’s right for you. There is seemingly a lot of peer pressure to keep you on the trail but really everyone wants what is best for each other. If you need to do something for yourself, leave or stay, do it. Make decisions based on yourself and what is good for you.
- Alternates are the best thing about the CDT, take all of the ones that interest you.
Animal Sightings
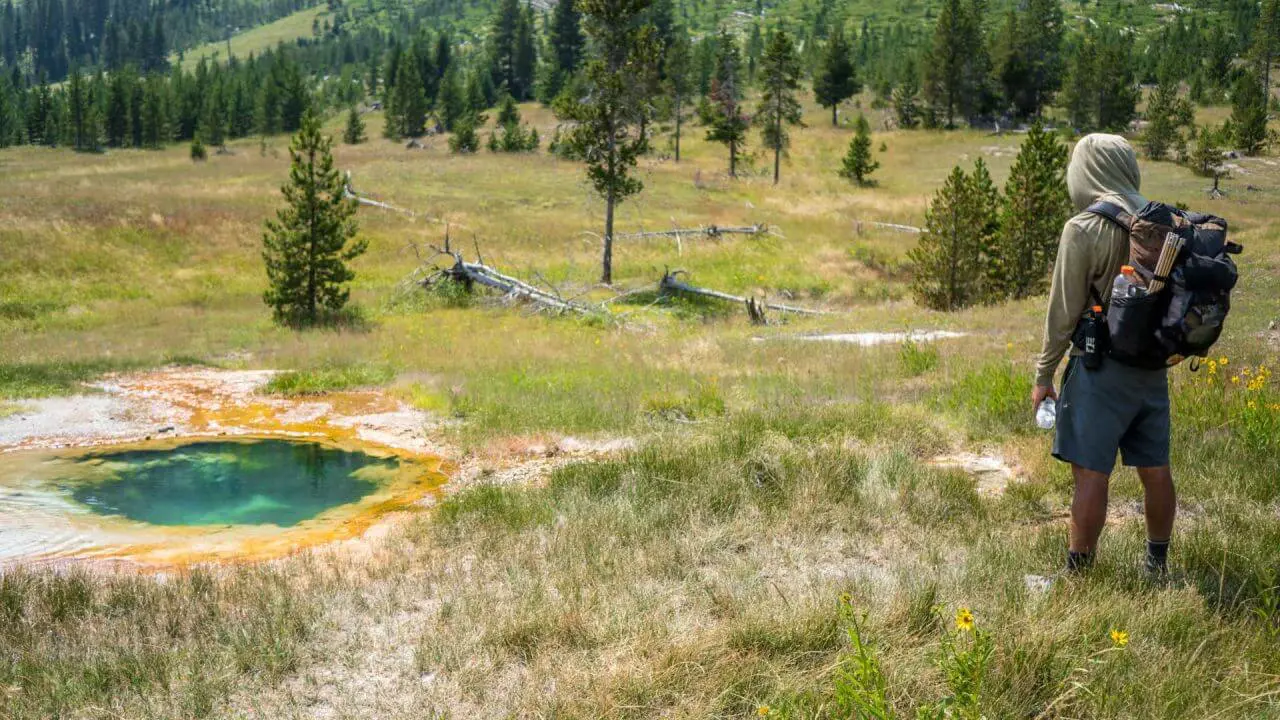
Now, some data that doesn’t quite fit anywhere else; what kind of wildlife did Continental Divide Trail hikers see on the trail? The most common animals? Deer. The worst. The rarest of the animal kingdom? Tortoise. I’ve hiked the Desert section of the CDT twice now and I have yet to see one of these mythical creatures.
At 71.2%, the number of hikers who claim to have seen a grizzly bear seems a bit high. I would wager that some percentage of these sightings were in fact light-colored black bears.
Animals Seen
- 100% Elk
- 98.6% Deer
- 97.3% Marmot
- 91.1% Mountain goat
- 90.4% Pika
- 84.9% Black bear
- 75.3% Fox
- 71.2% Grizzly bear
- 63.7% Rattlesnake
- 55.5% Owl
- 21.9% Skunk
- 10.3% Bobcat
- 8.2% Mountain lion
- 6.2% Tortoise

Note: Animals added for next year include bison, coyote, moose (don’t know how I left this out), pine marten, porcupine, and wolf
Support the Survey
Every year, I receive numerous requests for guidance on how to support the surveys. Beyond sharing them with your close-knit bubble of weird hiker friends, the best way to support the survey is to contribute via Patreon. You’ll get access to exclusive posts, discount codes, live streams, and super awesome stickers so that everyone will know how cool you are.
If you’re not into Patreon, that’s cool; you can Venmo @halfwayanywhere, Cash app $halfwayanywhere, or PayPal moc.erehwynayawflah@tcatnoc
This is not expected. The data collected in the survey will always be free and accessible to everyone who wants/needs it. Your support is much appreciated and helps pay the website (and survey) bills.


CDT Survey Collection
Finally, another HUGE THANK YOU to all the hikers who completed this year’s survey, including (but not limited to):
If you have any feedback, comments, suggestions to improve the survey, or data you would like to see in future posts or surveys, leave a comment below and let me know!
Affiliate Disclosure: This page may contain affiliate links, which means I may receive small commissions for purchases made via these links at no additional cost to you. This helps pay the bills and keep the site up and running. Thank you for your support!