The John Muir Trail Hiker Survey (2021)
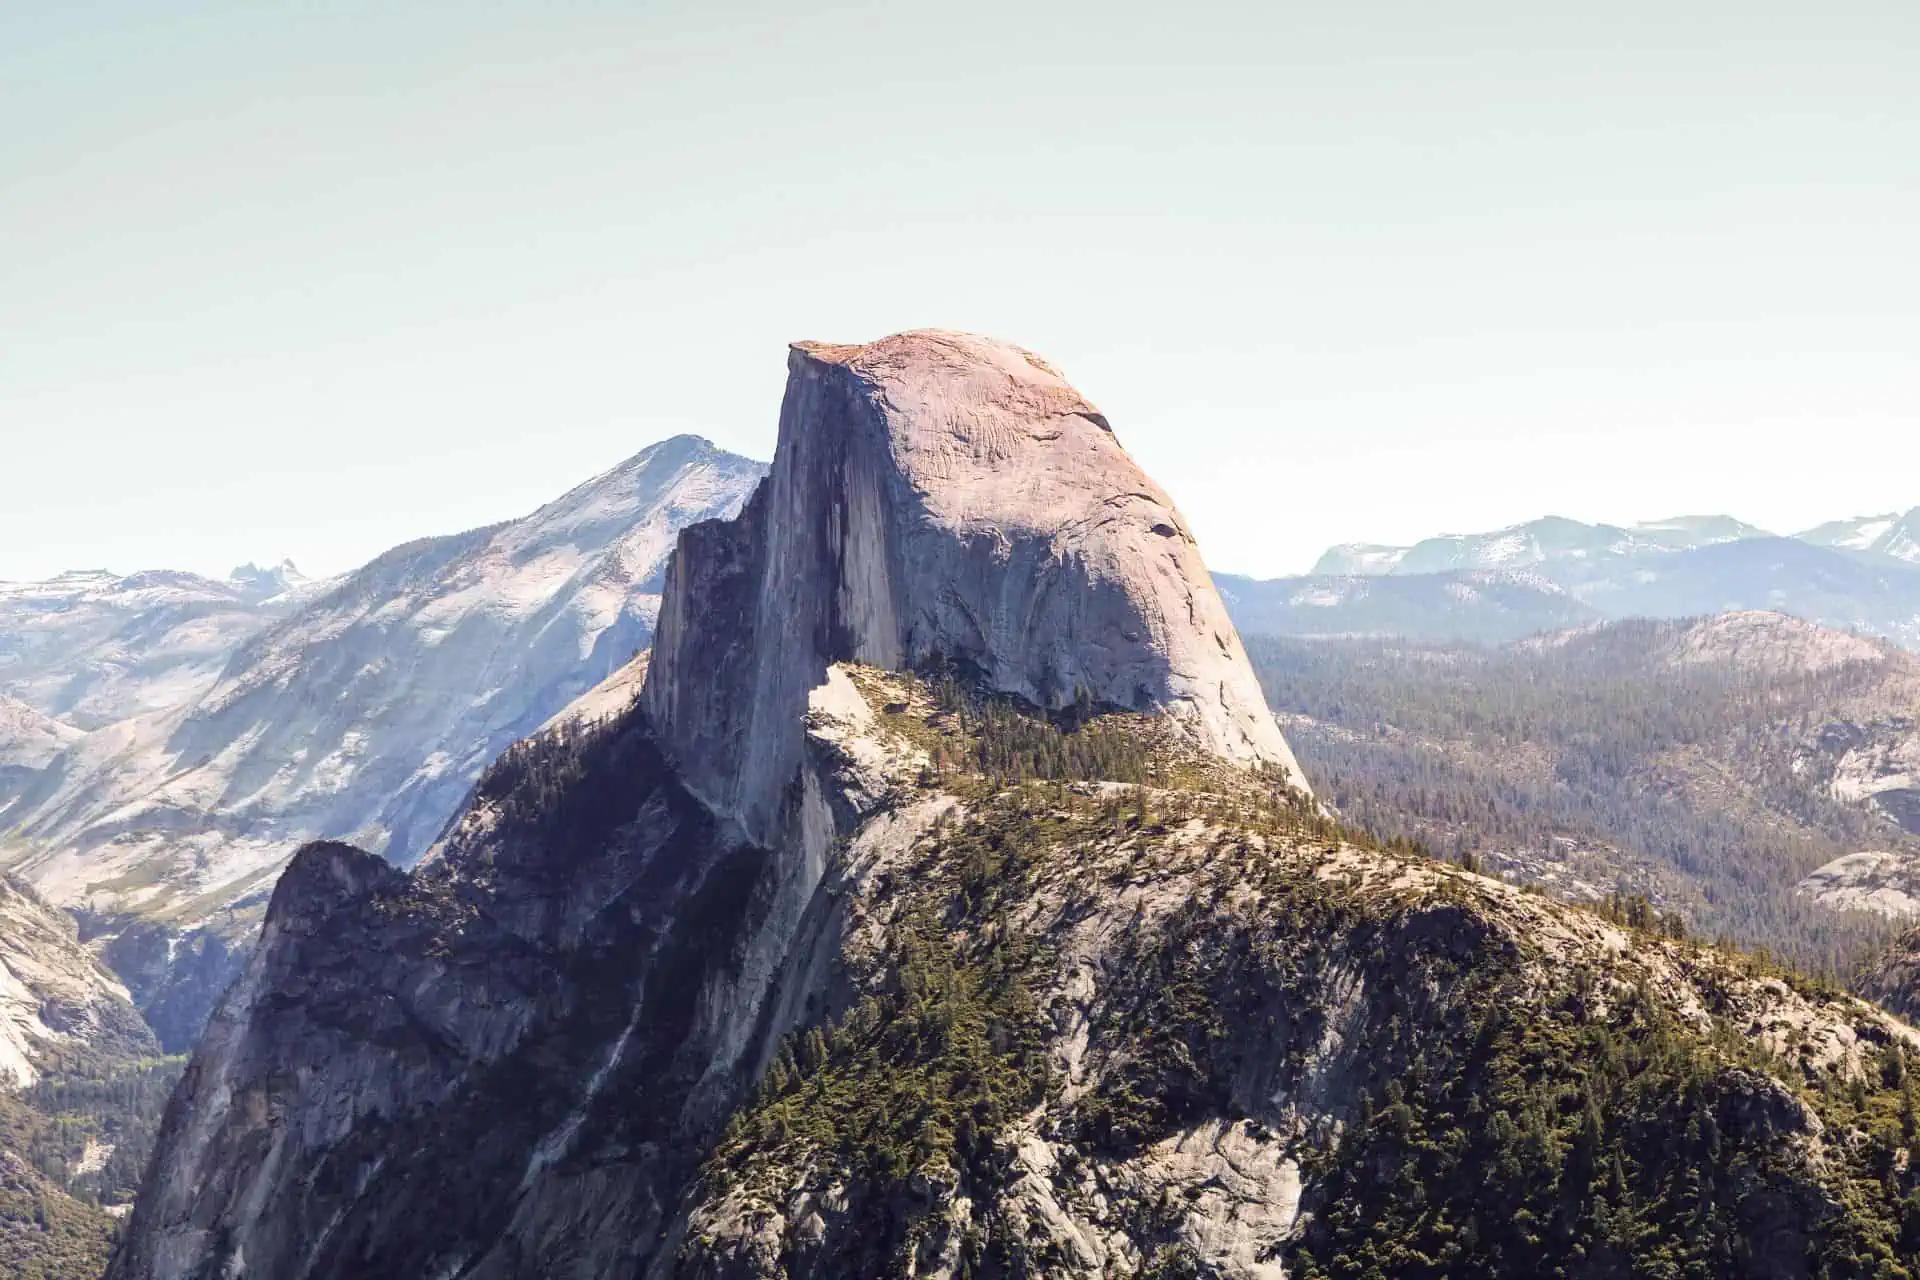
In an effort to get a more comprehensive look at thru-hikers and the long-distance hiking community, this year I launched the John Muir Trail Hiker Survey. The John Muir Trail (JMT) is a more accessible trail than the Pacific Crest Trail or the Continental Divide Trail and I anticipate it will be interesting to follow up this year’s round of surveys.
The JMT Survey is meant to be a useful resource to (actually) help those of you interested in hiking the John Muir Trail figure out how to best approach the journey. Every year, I try to improve the data collected, grow the number of respondents, and fine-tune the presentation to best help hikers. I would love to hear what you think in the comments below.
Note: The data is not going to be 100% guaranteed accurate, but the sample size is large enough that we’ll have a pretty good picture of this year’s class. Remember, I’m just a random guy on the internet trying to help JMT hikers; take it easy.
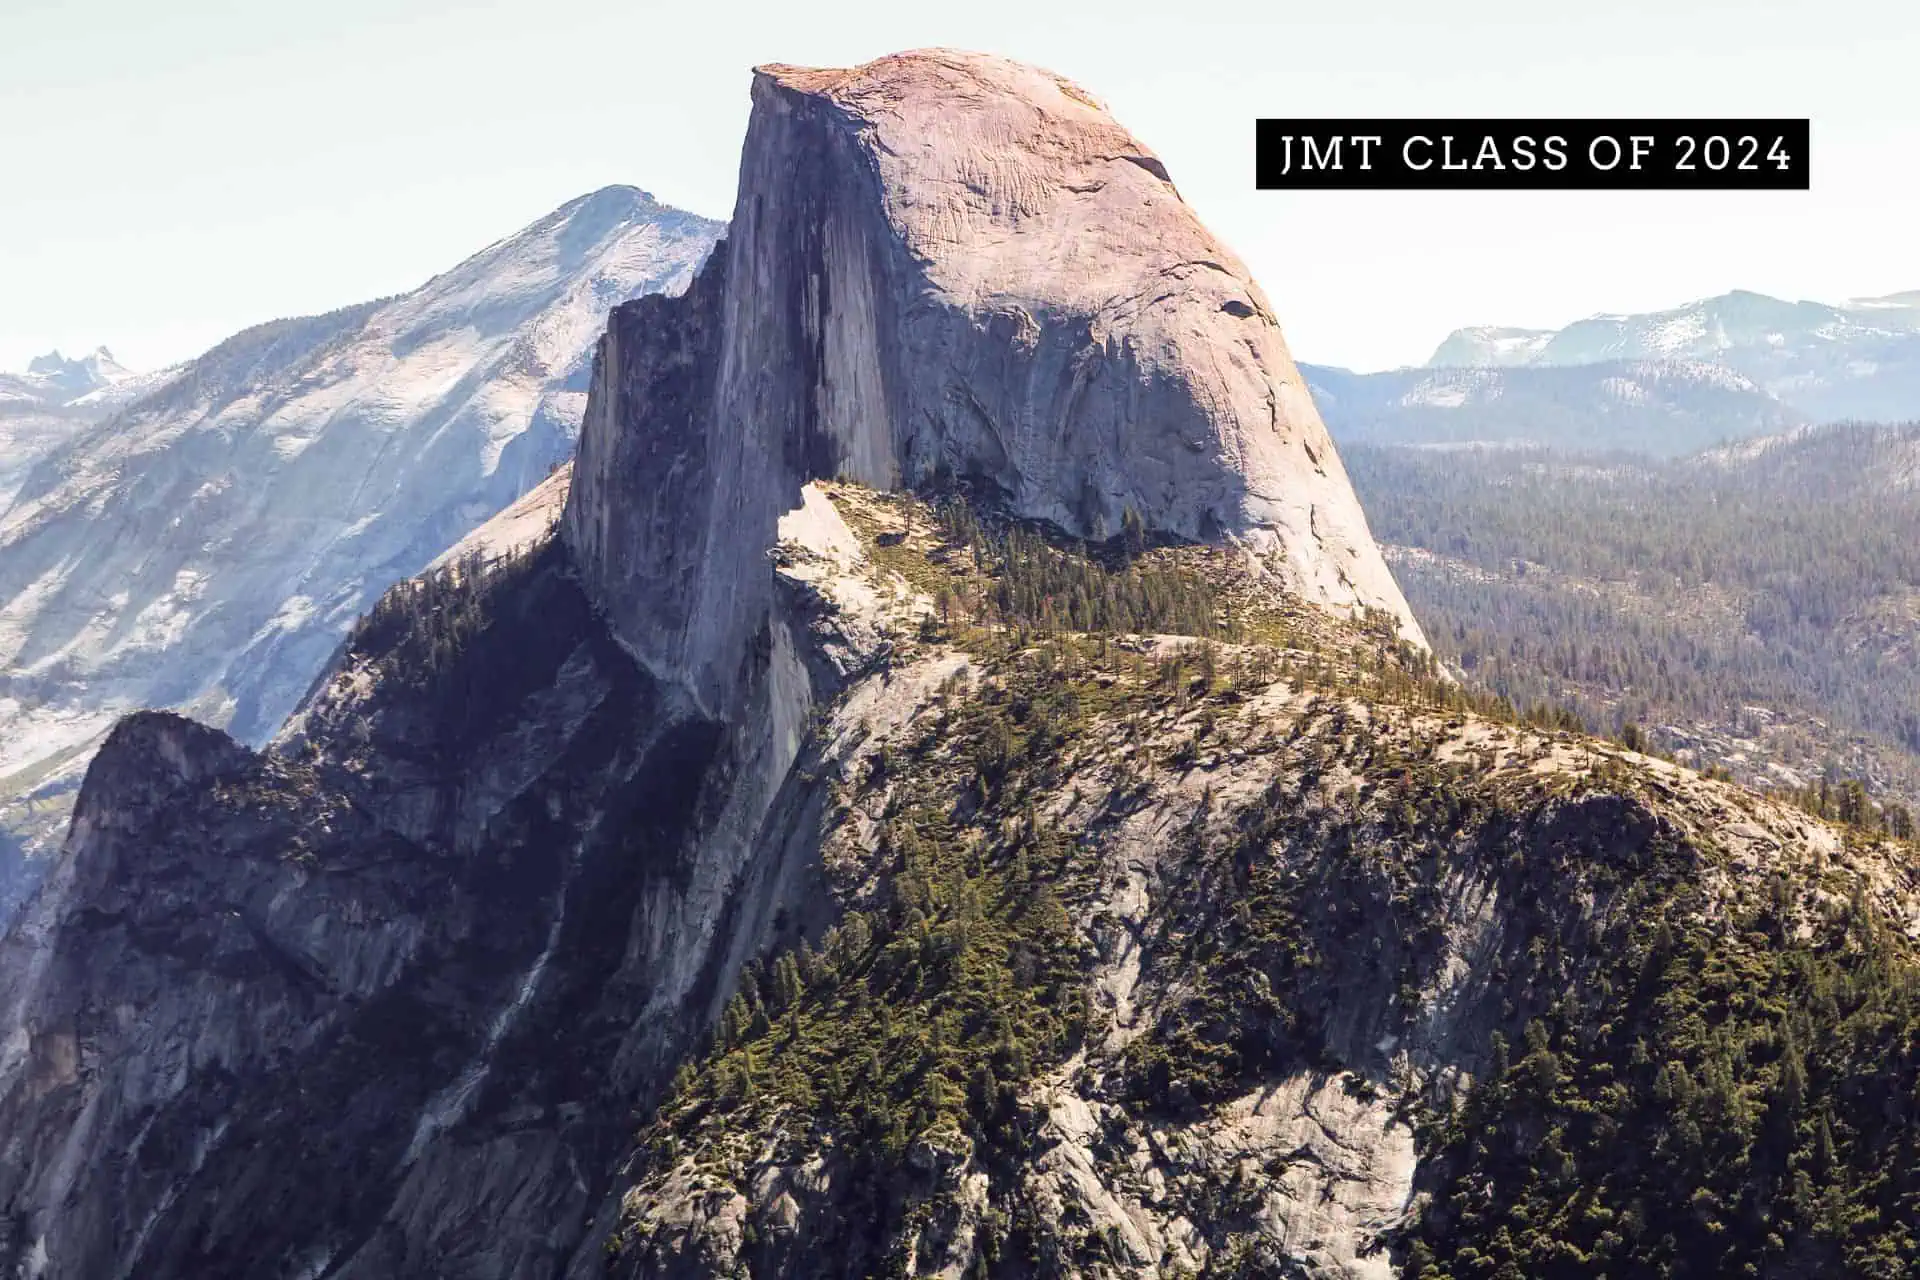
Congratulations on arriving at a spot in the JMT Survey most readers probably skip. Here are the results of Halfway Anywhere’s 2021 John Muir Trail Hiker Survey!

Notes on the data
- This year, we had 119 completed surveys (if you’re hiking the John Muir Trail next year, sign up to receive the survey here).
- Some responses have been sorted and colored to present the data in a friendlier manner (e.g. northbound vs. southbound responses).
- Not all JMT hikers meticulously document their stats so the data is not going to be 100% accurate.
- I refer to survey respondents collectively as this year’s “class“. Remember, this is a sample and not a comprehensive survey of every single hiker on the JMT this year.
- If they don’t recall more than math-exam anxiety, it’s suggested you familiarize yourself with the words average, median (M), and standard deviation (σ).
- For stats requiring the length of the John Muir Trail for a calculation (e.g. average mileage per day for the trail), I use 217.2 mi / 349.6 km.
- I will be releasing more detailed posts focused on JMT Gear, JMT Resupply, JMT Demographics, JMT Horror Stories, and JMT Advice. If you would like to be notified of new surveys, click here.
LABELS differentiating hiker segments:
- THRU: Thru-hikers (all)
- THRU-0: Thru-hikers who did NOT complete the JMT
- THRU-1: Thru-hikers who completed the entire JMT
- NOBO: Northbound thru-hikers (all)
- NOBO-0: Northbound thru-hikers who did NOT complete the JMT
- NOBO-1: Northbound thru-hikers who completed the JMT
- SOBO: Southbound thru-hikers (all)
- SOBO-0: Southbound thru-hikers who did NOT complete the JMT
- SOBO-1: Southbound thru-hikers who completed the JMT
If NO LABEL has been appended to a data point, then I used all data collected (i.e. it includes section hiker data in addition to thru-hiker data).
Demographics
In this section, we examine the demographics of this year’s John Muir Trail Class. Will this help you complete a JMT hike? Probably not. That said, it’s a nice way to ease into the mountain of data we have to examine. I will follow up this post (the one you’re reading now) with a more detailed breakdown and comparison of hikers based on their demographic data.
JMT Hiker Gender
- 49.5% Male
- 48.6% Female
- 0.9% Non-Binary
- 0.9% Masc Leaning

JMT Hiker Age
- 0.93% < 20
- 10.19% 20-24
- 10.19% 25-29
- 26.85% 30-34
- 9.26% 35-39
- 16.67% 40-49
- 15.74% 50-59
- 8.33% 60-69
- 0.93% >70
Average age: 39
Median age: 35
σ: 13

JMT Hiker Race
- 78.5% White
- 9.3% Asian
- 5.6% Hispanic or Latino
- 1.9% 2+ Races
- 0.9% Native Hawaiian or Other Pacific Islander
- 2.8% Decline to answer

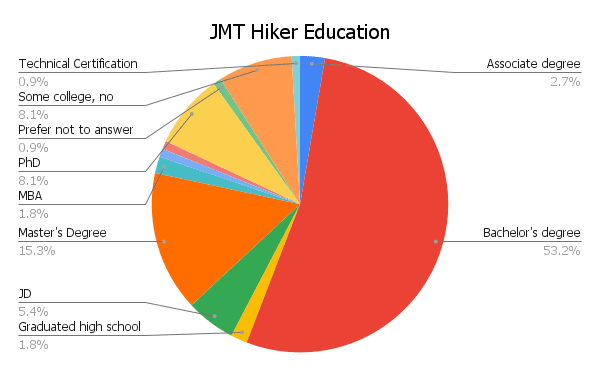
JMT Hiker Education
- 53.2% Bachelor’s degree
- 15.3% Master’s degree
- 8.1% Some college (no degree)
- 8.1% PhD
- 5.4% JD
- 2.7% Associate Degree
- 1.8% High school or equivalent
- 1.8% MBA
- 0.9% OD
- 0.9% Technical Certification
- 0.9% Decline to answer
Where Hikers Are From
Every year, people come from all over the country and the world to hike the John Muir Trail. Here’s a look at where hikers on the trail this year were from.
- Countries: Australia, Canada, Mexico, New Zealand, United States, Vietnam (6 total)
- States/Territories: Arkansas, California, Colorado, Illinois, Kentucky, Maryland, Massachusetts, Michigan, Minnesota, Mississippi, Montana, New Hampshire, New Jersey, New Mexico, New York, North Carolina, Ohio, Oregon, Pennsylvania, South Carolina, South Dakota, Texas, Utah, Washington (24 total)
A look at JMT hiker distribution across the world.

A look at which states/territories JMT hikers hail from.

Hiker Jobs & Working Conditions
How are people able to take time off to hike the John Muir Trail? Sure, you could do it in less than a week, but most people on the JMT will want to take their time.
I asked hikers what they do for work and how they were able to take time off to hike the JMT.
Hiker Jobs
This year, hikers reported 40 different professions. The most common of which were:
- 8% Educator
- 7% Registered Nurse
- 7% Scientist
- 7% Software Engineer
- 6% Attorney
- 6% Programmer
- 6% Project Manager
- 6% Student
A total of 7% reported being retired. More on this in the next section.

Hiker Working Conditions
So how was this year’s class able to take time off to hike the JMT?
- 51.6% Flexible work conditions
- 11% Unpaid time off
- 7.7% Student
- 6.6% Retired
- 5.5% Between jobs
- 4.4% Paid time off
- 4.4% Negotiated into employment
- 3.3% Seasonal worker
- 3.3% Unemployed
- 1.1% Sabbatical
- 1.1% Quit job to hike

Hiker Experience
Here’s a look at what the John Muir Trail Class of 2021 looked like during the planning phase of their hikes. This section examines first-time hikers, hiker experience level, and other trails hiked.
First long-distance hike?
Instead of asking respondents whether this would be/was their first long-distance hike, I asked the distance of their longest hike to date (pre-JMT). I decided to use 100 mi / 160 km as the cutoff (sorry, Wonderland Trail hikers). Want to yell at me for the arbitrary number I chose? Suggest a better one? Please yell at me in the comments.
THRU: First Time Hikers
- 73% Yes
- 27% No
Average longest trail hiked: 187 mi / 301 km
Median: 53 mi / 85 km

Hiker Experience Level
In addition to asking the longest trail completed by hikers pre-JMT, I ask respondents to evaluate their level of backpacking experience on a scale of 1 to 10.
- Average experience: 6.46
- Median experience: 7
- σ: 2.27
THRU-1: 6.58 (σ = 2.32)
THRU-0: 5.88 (σ = 2.39)

Pre-hike Training
Next, we’ll look at whether this year’s class trained in preparation for their thru-hikes, what they did to train, and how they rated their fitness (pre-JMT).
Did you train before your hike?
- 88.3% Yes
- 11.7% No

What did you do to train?
- 86.73% Day Hikes
- 58.16% Multi-day hikes
- 45.92% Running
- 33.67% Weight Training
- 27.55% Bicycling
- 21.43% Cross-training
- 12.24% Step Machine
- 4.08% Swimming
- 2.04% Other

Pre-trail Fitness Level
I asked hikers to rate their level of fitness (on a scale of 0 to 10) before beginning the trail.
Average fitness: 6.37
Median fitness: 6
σ: 1.41
THRU-1: 6.48 (σ = 1.42)
THRU-0: 6.13 (σ = 1.71)

Money Spent on Hike
The question of how much money is required for a John Muir Trail thru-hike is one that gets asked by a lot of would-be JMT hikers each year – especially if they’re starting out with little or no gear.
THRU-1
$1,679
The average amount spent on the entirety of the JMT
M = $1,500 | σ = $1,113
THRU-1
$94
The average amount spent per day on the JMT
M = $83 | σ = $65
THRU-1
$819
The average amount spent on gear before starting
M = $600 | σ = $688


Hiking Partners & Alone Time
Starting a long hike alone can be scary and intimidating, but it turns out many thru-hikers (and hikers in general) begin their hikes alone. Here, we’ll look at who hikers began with, how much time they spent hiking and camping alone, whether they stayed with their hiking partner(s), hiker relationships,
Did you begin your hike alone?
- 47% Began with a friend
- 30.8% Yes, alone
- 18.8% Began with a partner or spouse
- 1.7% Began with family member
- 1.7% Arranged to start with other hiker(s) whom they had not met before beginning
Of this year’s first-time thru-hikers, 24% began their hikes alone.

What percentage of the time did you spend hiking alone?
- 21.6% < 0%
- 7.8% 1-10%
- 11.2% 10-25%
- 12.9% 25-50%
- 12.1% 50-75%
- 9.5% 75-90%
- 13.8% 90-99%
- 11.2% 100%
Hiking alone here measures the amount of time that hikers weren’t physically walking with someone down the trail – not necessarily that they weren’t hiking with others over the course of the day.

What percentage of the time did you camp alone?
- 56.4% < 0%
- 2.6% 1-10%
- 9.4% 10-25%
- 8.6% 25-50%
- 6% 50-75%
- 5.1% 75-90%
- 4.3% 90-99%
- 7.7% 100%
When we look at thru-hikers who finished, this translates to an average of 4 nights spent camping alone.

Sticking with Hiking Partner(s)
Beginning a hike with someone else is one thing, but finishing a hike with someone else is entirely different. Here’s how things worked out for everyone who began their hikes with another person.
If you began your hike with someone else, did you remain with them for the entirety of the trail?
- 81.6% Yes
- 7.9% Mostly
- 6.6% No, wasn’t the plan
- 1.3% No, partner injured
- 1.3% No, wasn’t for best
- 1.3% No, now not friends

Size of Hiking Group
I ask hikers what the largest group was that they found themselves hiking with on a consistent basis. Some hikers refer to this as a “tramily“. This word is awful.
Average group size: 3.1
Median size: 3
σ: 2.5

Permits & Starting Dates
Getting a John Muir Trail permit can be the first obstacle for many hikers. For 2022, permit registration has moved to a weekly lottery on Recreation.gov. When to begin the JMT is a question of debate every year. There could be snow, bugs, or fires depending on when you’re traveling through the Sierra, and gauging when to hit the JMT can be a tricky decision.
Did you receive a permit for the start day you wanted?
- 57.5% Yes (received a permit for date wanted)
- 15.1% No, but still happy with permit date
- 9.4% Yes, received a permit for +/- 3 days of date
- 8.5% Yes, received a permit for +/- 5 days of date
- 8.5% Yes, received a permit for +/- 1 day of date
- 0.9% Not happy with permit date

Hiker Start Months


The John Muir Trail is traditionally hiked southbound – starting at Happy Isles Trailhead in Yosemite National Park and ending at Whitney Portal Trailhead in Inyo National Forest.
However, with more competition for permits and due to personal circumstances or logistics, many hikers have started to explore alternatives to the traditional route. This could mean either beginning elsewhere in Yosemite or reversing the route and hiking northbound.
The most popular starting location for John Muir Trail hikers was still Happy Isles, but not by much. Meanwhile, most northbound JMT hikers began their hikes at Horseshoe Meadow via either the Cottonwood Pass Trailhead or New Army Pass (via the Cottonwood Lakes Trailhead).


Hiking Stats & Dates
In this section, we look at a breakdown of hike lengths and averages, and a look at how many days hikers took off (zero days) or did very few miles (nearo days).
Length of Thru-hikes
THRU-1
19.6
The average number of days of an entire thru-hike
(M = 19 | σ = 8.9)
THRU-1
18.6
The average number of days hiking (total minus zero days)
(M = 17.5 | σ = 8.6)
THRU-1
12.2
The average daily mileage (19.6 km)
(σ = 3.7 mi / 6 km)
THRU-1
12.8
The average daily mileage after removing zero days (20.6 km)
(σ = 3.6 mi / 5.8 km)
THRU-1
19.6
The average longest day of hiking (31.5 km)
(M = 19 | σ = 4 mi / 6.4 km)
THRU-1
1
The average number of zero days (days off from hiking)
(M = 1 | σ = 1.18)
THRU-1
1
The average number of nearo days (low mileage days)
(M = 1 | σ = 1)
THRU-1
1
The average longest consecutive number of zero days
(M = 1 | σ = 0.8)
Alternate Routes
The John Muir Trail is well-defined, but there are a number of alternates (sometimes also known as “shortcuts”) hikers can take either in lieu of or in addition to the official JMT. I ask about these alternates to get an idea of what the most common JMT thru-hike looks like. Alternates are listed in geographical order from north to south.
The following colors indicate the popularity of each alternate (the percentage of hikers who reported taking each): OVER 75%, 50-75%, 25-50%, LESS THAN 25%.
- Tuolumne Campground Trail 21.4%
- Pacific Crest Trail (between Thousand Island Lake and Agnew Meadows) 10.3%
- Devils Postpile Trail 49.6%
- Mammoth Pass Trail 4.3%
- Duck Pass Trail 5.1%
- Cascade/Fish Valley Trail 2.6%
- Goodale Pass Trail (in and/or out of VVR) 22.2%
- Bear Ridge Trail (in and/or out of VVR) 23.9%
- Blayney Meadows Trail 6%
- Piute Pass Trail (to/from North Lake) 2.6%
- Bishop Pass Trail (to/from South Lake) 4.3%
- Sawmill Pass Trail 1.7%
- Kearsarge Pass Trail (to/from Onion Valley) 36.8%
- New Army Pass Trail (to/from Horseshoe Meadow) 7.7%
- Cottonwood Lakes/Army Pass Trail (to/from Horseshoe Meadow) 1.7%
- Cottonwood Pass Trail (to/from Horseshoe Meadow) 22.2%
Not an alternate, but instead the official destination of a traditional southbound JMT thru-hike, Mount Whitney is not an objective that all JMT hikers find themselves atop. Here’s a look at the number of thru-hikers who summited the highest peak in the Continental United States and the reasons some decided to skip it.
Did you summit Mount Whitney?
THRU-1 85% Yes
THRU-1 15% No

Why didn’t you summit Mount Whitney?
- 30% Weather
- 30% Problems with altitude
- 30% Already summited (another time)
- 10% No interest

Why Hikers Didn’t Finish
Here we’ll look at the specifics as to why hikers didn’t complete the John Muir Trail this year.
Why hikers didn’t complete the JMT
- 33.3% Fires
- 20% Personal
- 20% Injury
- 13.3% Work
- 6.7% Too crowded
- 6.7% Illness

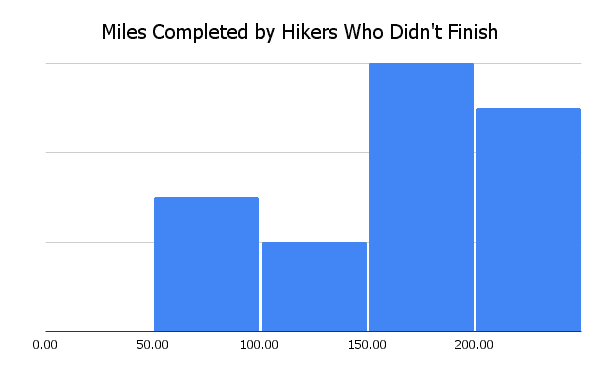
The number of miles completed by hikers who didn’t finish the JMT
- 18.8% – 50 to 100 mi / 80 to 160 km
- 12.5% – 100 to 150 mi / 160 to 241 km
- 37.5% – 150 to 200 mi / 241 to 322 km
- 31.3% – 200 to 250 mi / 322 to 402 km
Average: 155 mi / 250 km
Median: 56
Resupply
The word “resupply” can be anxiety-inducing if you’re new to the idea of a thru-hike. What is resupply? Where does it come from? How much of it is there? How do you get it? Will it hurt?
Basically, resupply is getting yourself more food to power more hiking. Nothing that needs to be too scary or intimidating. Resupply on a John Muir Trail is fairly straightforward since you only have so many options as far as getting yourself more calories to carry in your bear canister (yes, please bring and use a bear canister – it’s required), but when and where hikers resupply is still a question many find quite scary.
Here we have this year’s resupply stats, resupply strategy/boxes, resupply box suggestions, where hikers resupplied, favorite and least favorite resupply stops, favorite meals and snacks, and resupply advice.
JMT Resupply Stats
THRU-1
2
The average number of resupplies over the trail
(M = 2 | σ = 1)
THRU-1
7
The average number of days between resupplies
(M = 7 | σ = 2)
THRU
2.1
The average number of resupply boxes sent
(M = 2 | σ = 1)
Thru-hiker Resupply Strategy
- 7.4% Mailed all resupplies
- 17.6% Mailed some resupplies
- 4.4% Mailed no resupplies
Where hikers “definitely suggest mailing a box”
- Muir Trail Ranch 61.9%
- Red’s Meadow 58.3%
- Vermilion Valley Resort (VVR) 27.4%

Where Hikers Resupplied
I ask hikers to report where they resupply – not where they stopped/passed through, but where they actually purchased, picked up, were given, or otherwise came into a new stock of food.
Locations are listed in geographical order from north to south. Again, I used the following colors to indicate each resupply stop’s popularity: OVER 75%, 50-75%, 25-50%, LESS THAN 25%.
- Tuolumne Meadows 20%
- Red’s Meadow 68.2%
- Mammoth Lakes 9.4%
- Vermilion Valley Resort (VVR) 28.2%
- Bishop (via Kearsarge Pass/Onion Valley) 7.1%
- Muir Trail Ranch 74.1%
- Charlotte Lake (resupply delivered) 3.5%
- Independence (via Kearsarge Pass/Onion Valley) 30.6%
- Independence (via Horseshoe Meadow) 1.2%
Favorite & Least Favorite Resupply Stops
Now we know the most popular stops for resupplying and for sending boxes, but what about hikers’ favorite and least favorite resupply stops?
Note: When asking this question I specify “‘Favorite/Least Favorite’ means where you most/least enjoyed, not where you had the best/worst resupply options (although these could be the same).”
FAVORITE RESUPPLY STOP
Red’s Meadow
LEAST FAVORITE RESUPPLY STOP
Muir Trail Ranch
Favorite Meals & Snacks
As part of my quest for better backpacking meals, I ask John Muir Trail hikers to share their favorite sources of calories whilst on the trail. More on this to come in the JMT Resupply Guide.
Favorite Backpacking Meals


Resupply Changes
Hindsight is 20/20 (unless you’re looking back through the darkness for that mountain lion you think might be following you). Here is what hikers said they would change about their resupply strategies if they had the chance to do it all over again. These don’t change much from year to year, so I would highly encourage you to heed this advice when considering your resupply options.
- Send MORE VARIETY in boxes (32.5%)
- Send LESS FOOD in boxes (32.5%)
- Send FEWER resupply boxes* (7.7%)
*The average number of boxes sent by hikers who said they would have liked to have sent FEWER boxes was 3; the average was 2.
THRU
4.2%
The number of thru-hikers who went stoveless for the entirety of their hikes.
I’ll be following up this post with a more detailed breakdown of this year’s JMT resupply. If you would like to be notified of new posts, click here.
Thru-hiking Gear
John Muir Trail hikers spend a lot of time deciding on their gear. Gear choices play an essential role in a thru-hike, but there is no magical gear combination that will guarantee you success. I will do a deep dive into the gear used by JMT hikers this year, but the following will give a taste of what the gear choices were this year and what’s to come.
Let’s take a look at what this year’s JMT Class had with them out on the trail.
THRU-1
22.34 lbs
Average pre-hike base weight (10.133 kg)
(M = 20 lbs / 9.07 kg)
THRU-1
20.74 lbs
Average post-hike base weight (9.407 kg)
(M = 20 lbs / 9.07 kg)
THRU-1
-1.6 lbs
Average total change in base weight (726 g)
(M = 1.5 lbs / 680 g)
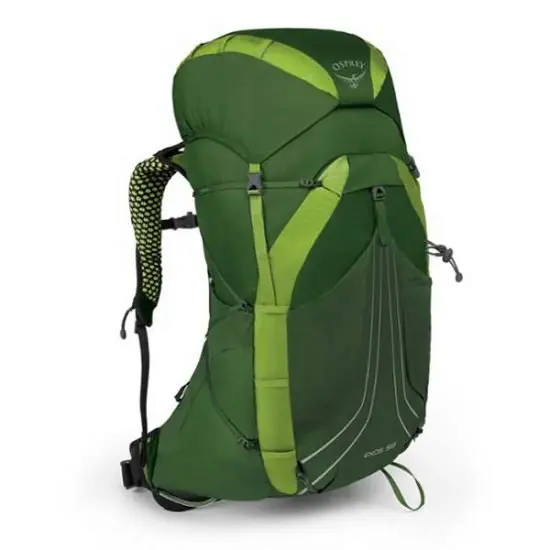
THRU
56.5 L
Average backpack size
(M = 55)
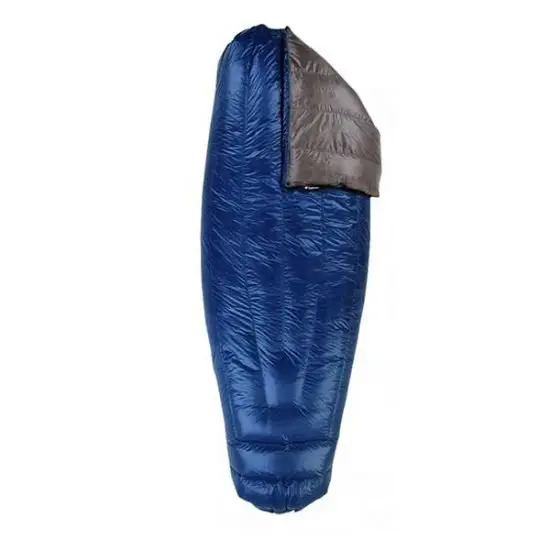
THRU
17.3°F
Average sleeping bag rating (-8.1°C)
(M = 20°F / -6.6°C)
THRU-1
15%
Number of hikers who used a foam sleeping pad
There are more detailed and more interesting breakdowns of this information on the way in this year’s JMT Gear Guide. For now, let’s take a peek at some of the gear thru-hikers were using on the trail this year. Here are the most common “Big 4” items: packs, shelters, sleeping bags, and sleeping pads (I know it’s the “Big 3”, but I include sleeping pads, get over it) along with the most common insulated jackets and shells.
Most Popular JMT Backpacks
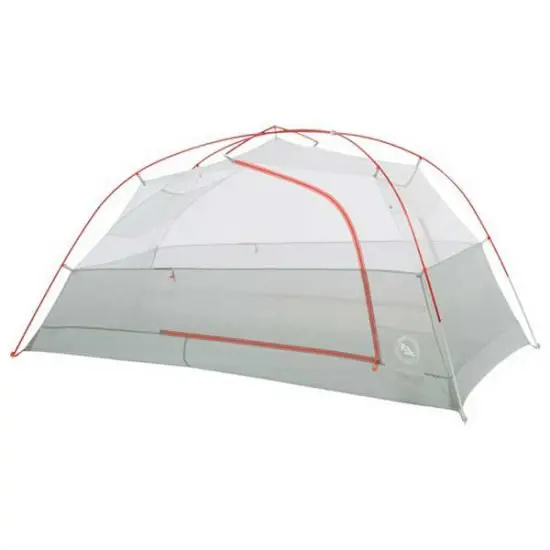
Most Popular JMT Shelters
Most Popular JMT Sleeping Bags
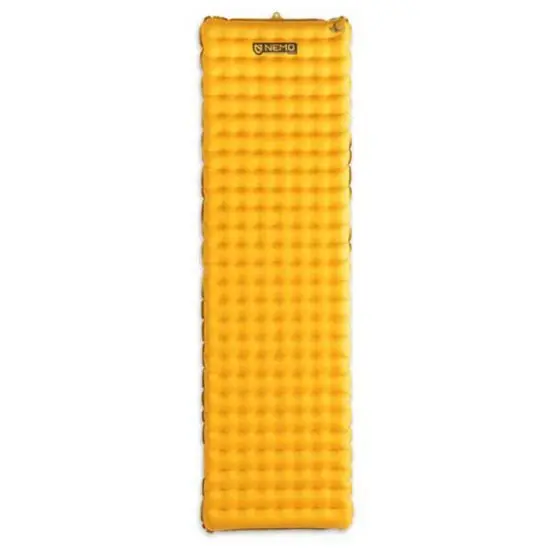
Most Popular JMT Sleeping Pads
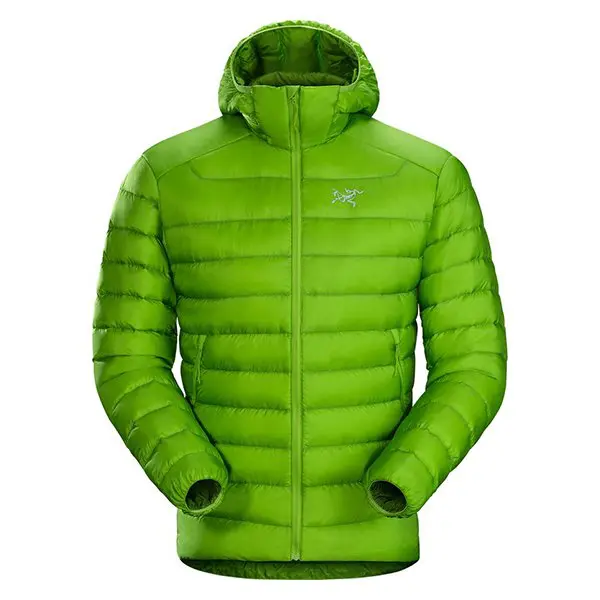
Most Popular JMT Insulated Jackets
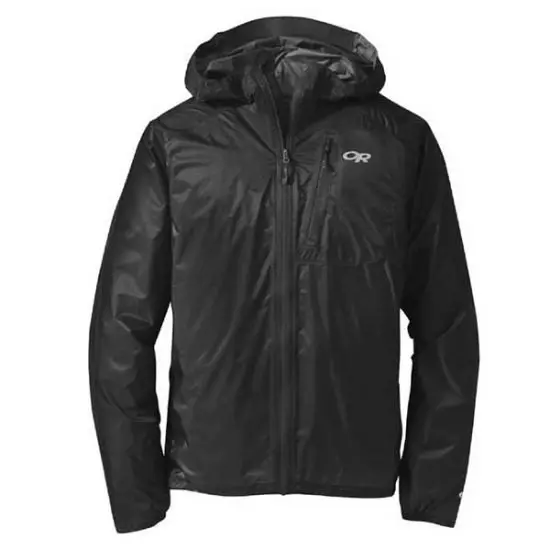
Most Popular JMT Shells
This is just the tip of the proverbial thru-hiking iceberg in the gear department. As mentioned above, I will soon be publishing a detailed breakdown of this year’s JMT gear. This will include the all-important shoes, snow gear, luxury items, what hikers didn’t like about their gear, what gear decisions (might have) helped hikers to a successful thru-hike, how hikers would change/adapt their gear for a future hike, and more.
For more on gear, check out more of the best backpacking gear.
Technology on Trail
Gone are the days of the John Muir Trail requiring everyone to navigate their trips with a paper map and compass using sketches from former hikers to identify landmarks. That said, a map and compass aren’t necessarily terrible things to have with you and many would never leave home without them. But the reality is that there are apps available to JMT hikers and there’s no reason you shouldn’t take advantage of the tools available.
Here are the phones and apps hikers were using out on the trail this year.
Which type of phone did you carry?
- 72.9% iPhone
- 25.4% Android
- 1.7% Didn’t carry a phone

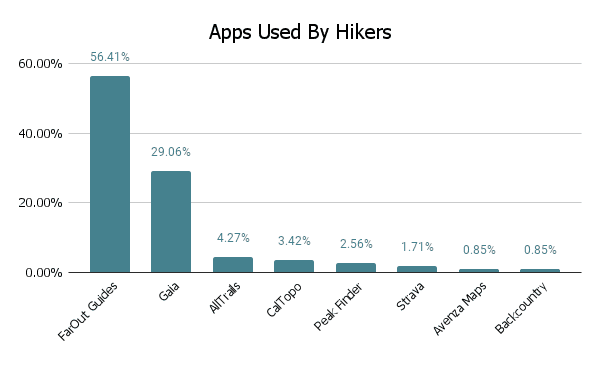
Which apps did you use?
Hiker Health & Filtering
Water treatment and hygiene are big considerations for hikers (or at least they should be). That said, it’s typically something thru-hikers worry less about as the trail goes on.
Some hikers religiously filter all water that passes through their face hole – it doesn’t matter if it comes out of a hotel sink or a puddle with a cow pooping in it. Other hikers will “not filter in the Sierra”, “not filter above 10,000 ft / 3,048 m”, or “not filter running water” (this last one is not a good idea – running water can definitely get you sick).
To find out how good a job everyone is doing filtering their water and sanitizing their hands after pooping (another way to get yourself sick), I ask hikers how often they treated water sources and whether they got get sick (defined as three or more days of digestive issues or diagnosed giardia).
- 1.3% Always treated, got sick
- 88.8% Always treated, never got sick
- 5.2% Usually treated, never got sick
- 3.4% Sometimes treated, never got sick

Looking at this another way, we can see:
- 90.1% of hikers always treated their water and 2.8% of these hikers got sick
- 5.2% of hikers usually treated their water and 0% of these hikers got sick
- 0% of hikers never treated their water
In total, a reported 2.6% of hikers came down with something akin to (or diagnosed) giardia.
Favorite/Least Favorite Sections
The John Muir Trail is a relatively long hike with a lot to see (mostly bears). Here is a look at the favorite and least favorite sections of the trail.
Favorite JMT Sections
- Evolution Basin
- Rae Lakes
- Mount Whitney
- Kings Canyon National Park
- Thousand Island Lake

Least Favorite JMT Sections
- Yosemite Burn Area
- Reds Meadow
- Tuolumne Meadows
- Mammoth Area
- Bear Ridge
- Whitney Portal Trail

Fear, Regrets, and Advice
When asked if hikers ever felt legitimately afraid on the trail, this is what they had to report. See if you can spot a theme. If you’ve never experienced a thunderstorm directly overhead while in the mountains above treeline, you may be surprised at how much more threatening it is than watching that same storm through a window while warm inside your car or home.
- Severe storm at Garnet created some concern about staying dry and making sure no hypothermia risk and that gear would remain in one piece.
- There were lightning storms the last four days of my trip. I was worried about being struck or a fire starting near me. One rolled in when I was camped at Guitar Lake, thankfully it wasn’t right on top of me, but it was still scary because it felt like such an exposed place.
- Getting caught at treeline in a hail/thunderstorm on Silver Pass after crossing the pass under blue skies.
- The very first night. I was hoping to make it over Donahue Pass but decided to camp at upper Lyell Canyon. It was rainy and windy, lightning storm all night. I was afraid of getting struck by lightning during the storm. I should have stopped a few miles earlier, and camped in Lyell Canyon. That scary night caused me to always ascend the passes in the early morning, and as a result, it caused me to always hike to the end of the day to set up for an early morning ascent over the peaks.
- Massive lightning and hail storm right before Donahue [Pass]. Threw a wrench in my itinerary and it was just creepy being stuck in that outlet.
- When a buck was chasing other people down the trail (not sure why) and when lightning struck a tree and there was smoke (was a non-issue though).
Now for John Muir Trail thru-hiker wisdom. I asked hikers what they would have done differently before their hikes if they were to do it all over again.
- 21.4% – Bought lighter gear
- 18.8% – Trained more/gotten in better shape
- 18% – Had gear more dialed in
- 9.4% – Done more practice hikes
- 9.4% – Started earlier
THRU
23.5 lbs
The average base weight of hikers who said they would have liked to have gotten lighter gear before starting their hikes (10.659 kg)
In addition to asking hikers what they would have done differently before their thru-hikes, I asked them what they wish they had done differently during their hikes. Here are the top responses (regrets):
- 29.9% – Slowed down
- 23.1% – More pictures of people
- 12.8% – More zero days
- 12% – Maintained a journal/blog
- 11.1% – More trail zeros
THRU
89.2%
The average percent of the time JMT hikers packed out their toilet paper.
I ask hikers what advice they have for future JMT hikers. This will be thoroughly documented in the upcoming post JMT: Advice For The Future, but for now, here is a sampling.
- Build in one extra day to your itinerary to allow you to stop somewhere cool and unplanned.
- Never give up, it gets easier. Talk to everyone you see. Share food!
- If you’re able, keep your permit as open as possible. Avoid Mammoth on weekends! ENJOY IT.
- I wish I had journaled. Now that I’m off the trail, it all blends together.
- Plan for rain. We planned for minimal rain based on the reputation of the Sierra, but encountered rain almost every day and had rain all day 1/4 of our hike. The Sierra weather was, for us at least, the most consistently bad weather I’ve ever encountered in the mountains.
- Make a trail family and REMEMBER TO TAKE PHOTOS WITH THEM!
Animal Sightings
Lastly, we have some data that I don’t really feel fits anywhere else and so I’ve just decided to tack it on at the end. What kind of wildlife did John Muir Trail hikers see in the Sierra Nevada?
The most common animals? Deer. The rarest of the animal kingdom? Bobcats and coyotes.
Animals Hikers Spotted
- 92.3% Deer
- 89.7% Marmot
- 62.4% Pika
- 42.7% Bear
- 11.1% Fox
- 9.4% Owl
- 9.4% Rattlesnake
- 6.8% Elk*
- 2.6% Mountain Goat
- 1.7% Bobcat
- 1.7% Coyote
*Note: there are no elk in the Sierra :P

Support the Survey
Every year, I receive numerous requests for guidance on how to support the surveys. Beyond sharing them with your close-knit bubble of weird hiker friends, the best way to support the survey is to contribute via Patreon. You’ll get access to exclusive posts, discount codes, live streams, and super awesome stickers so that everyone will know how cool you are.
If you’re not into Patreon, that’s cool; you can Venmo @halfwayanywhere, Cash app $halfwayanywhere, or PayPal moc.erehwynayawflah@tcatnoc
This is not expected. The data collected in the survey will always be free and accessible to everyone who wants/needs it. Your support is much appreciated and helps pay the website (and survey) bills.


Finally, another HUGE THANK YOU to all the hikers who completed this year’s survey. If you have any feedback, comments, suggestions to improve the survey, or data you would like to see in future posts or surveys, leave a comment below and let me know!
Affiliate Disclosure: This page may contain affiliate links, which means I may receive small commissions for purchases made via these links at no additional cost to you. This helps pay the bills and keep the site up and running. Thank you for your support!