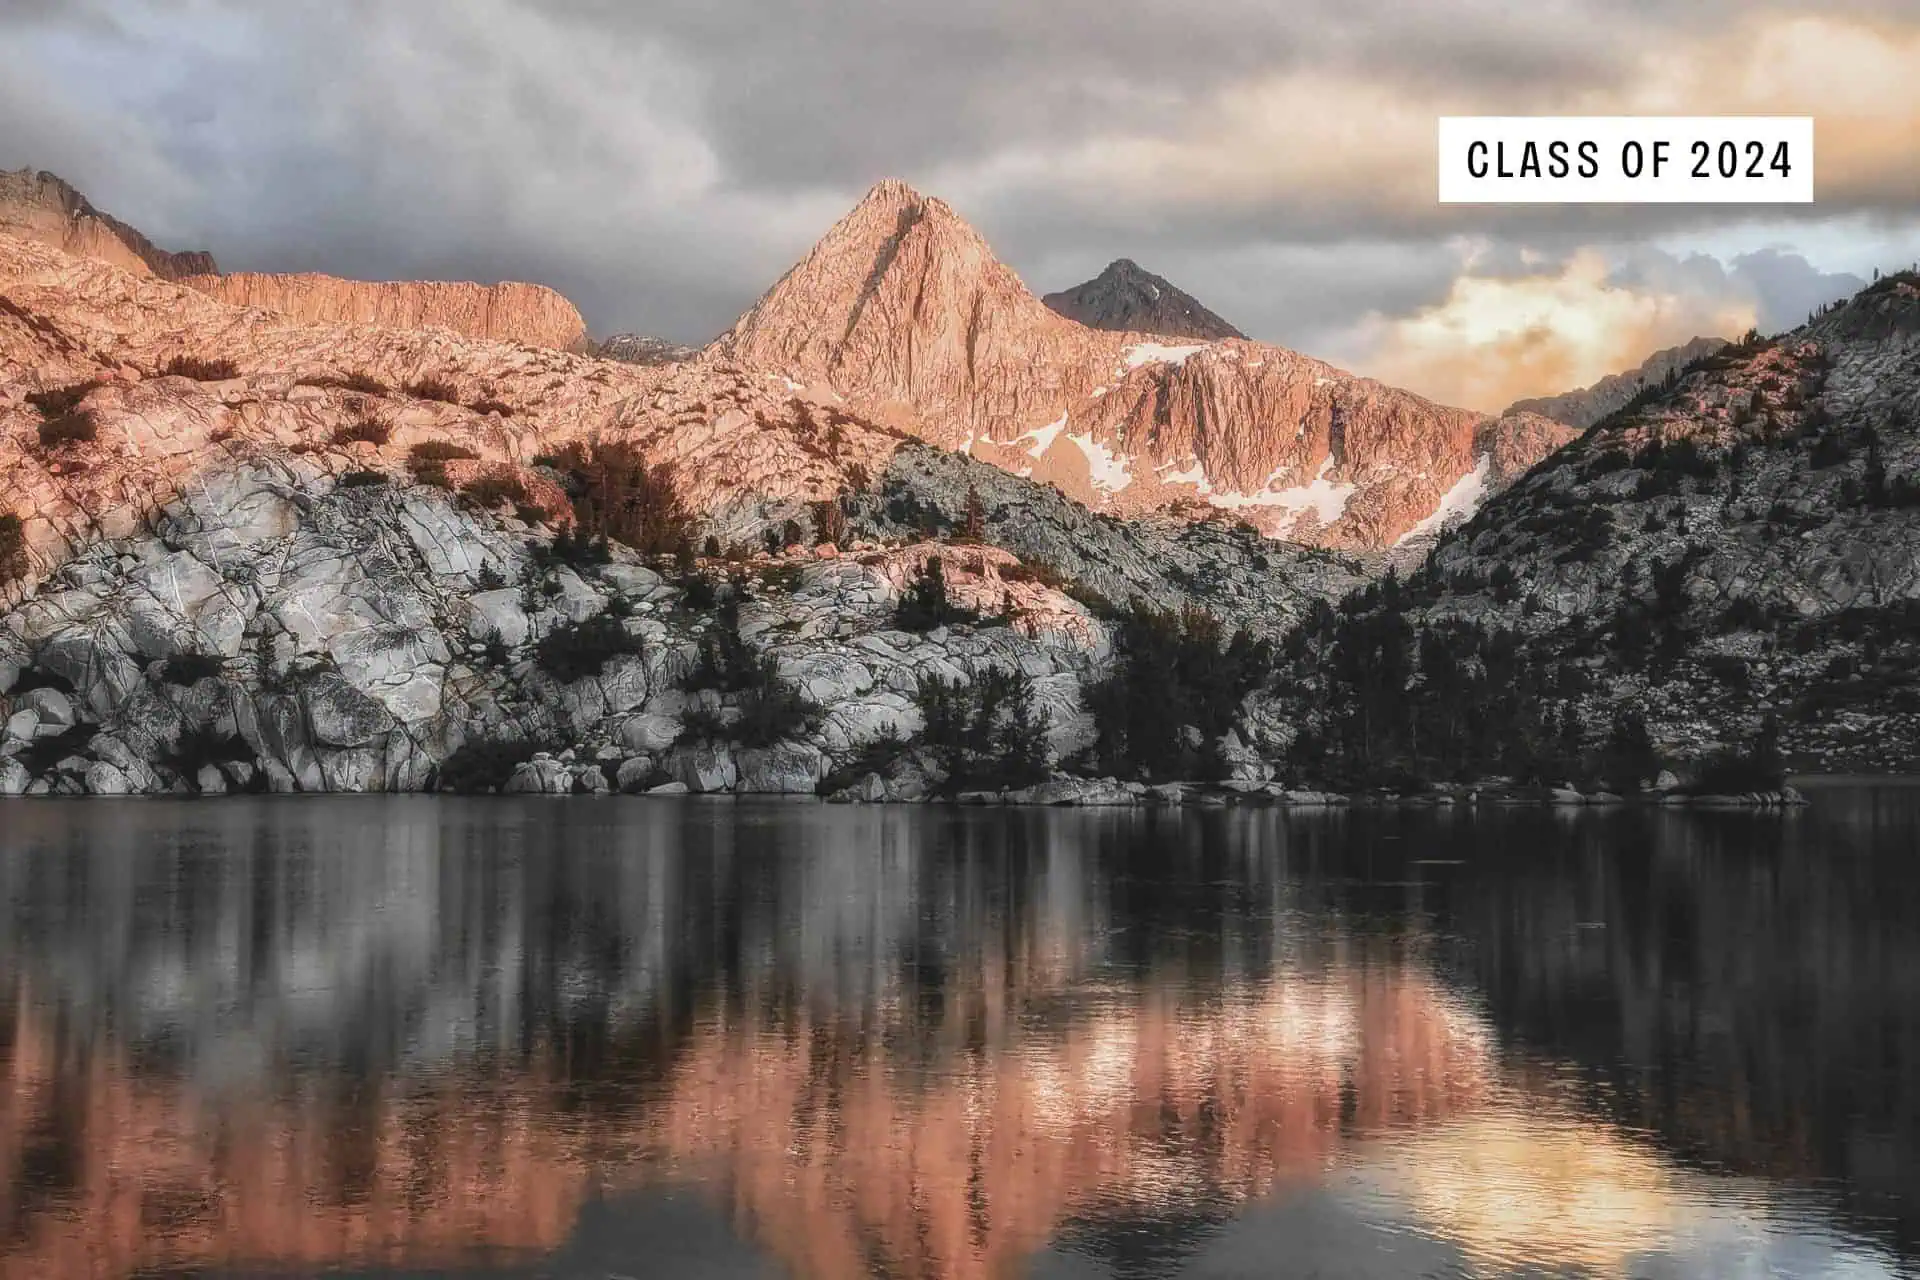
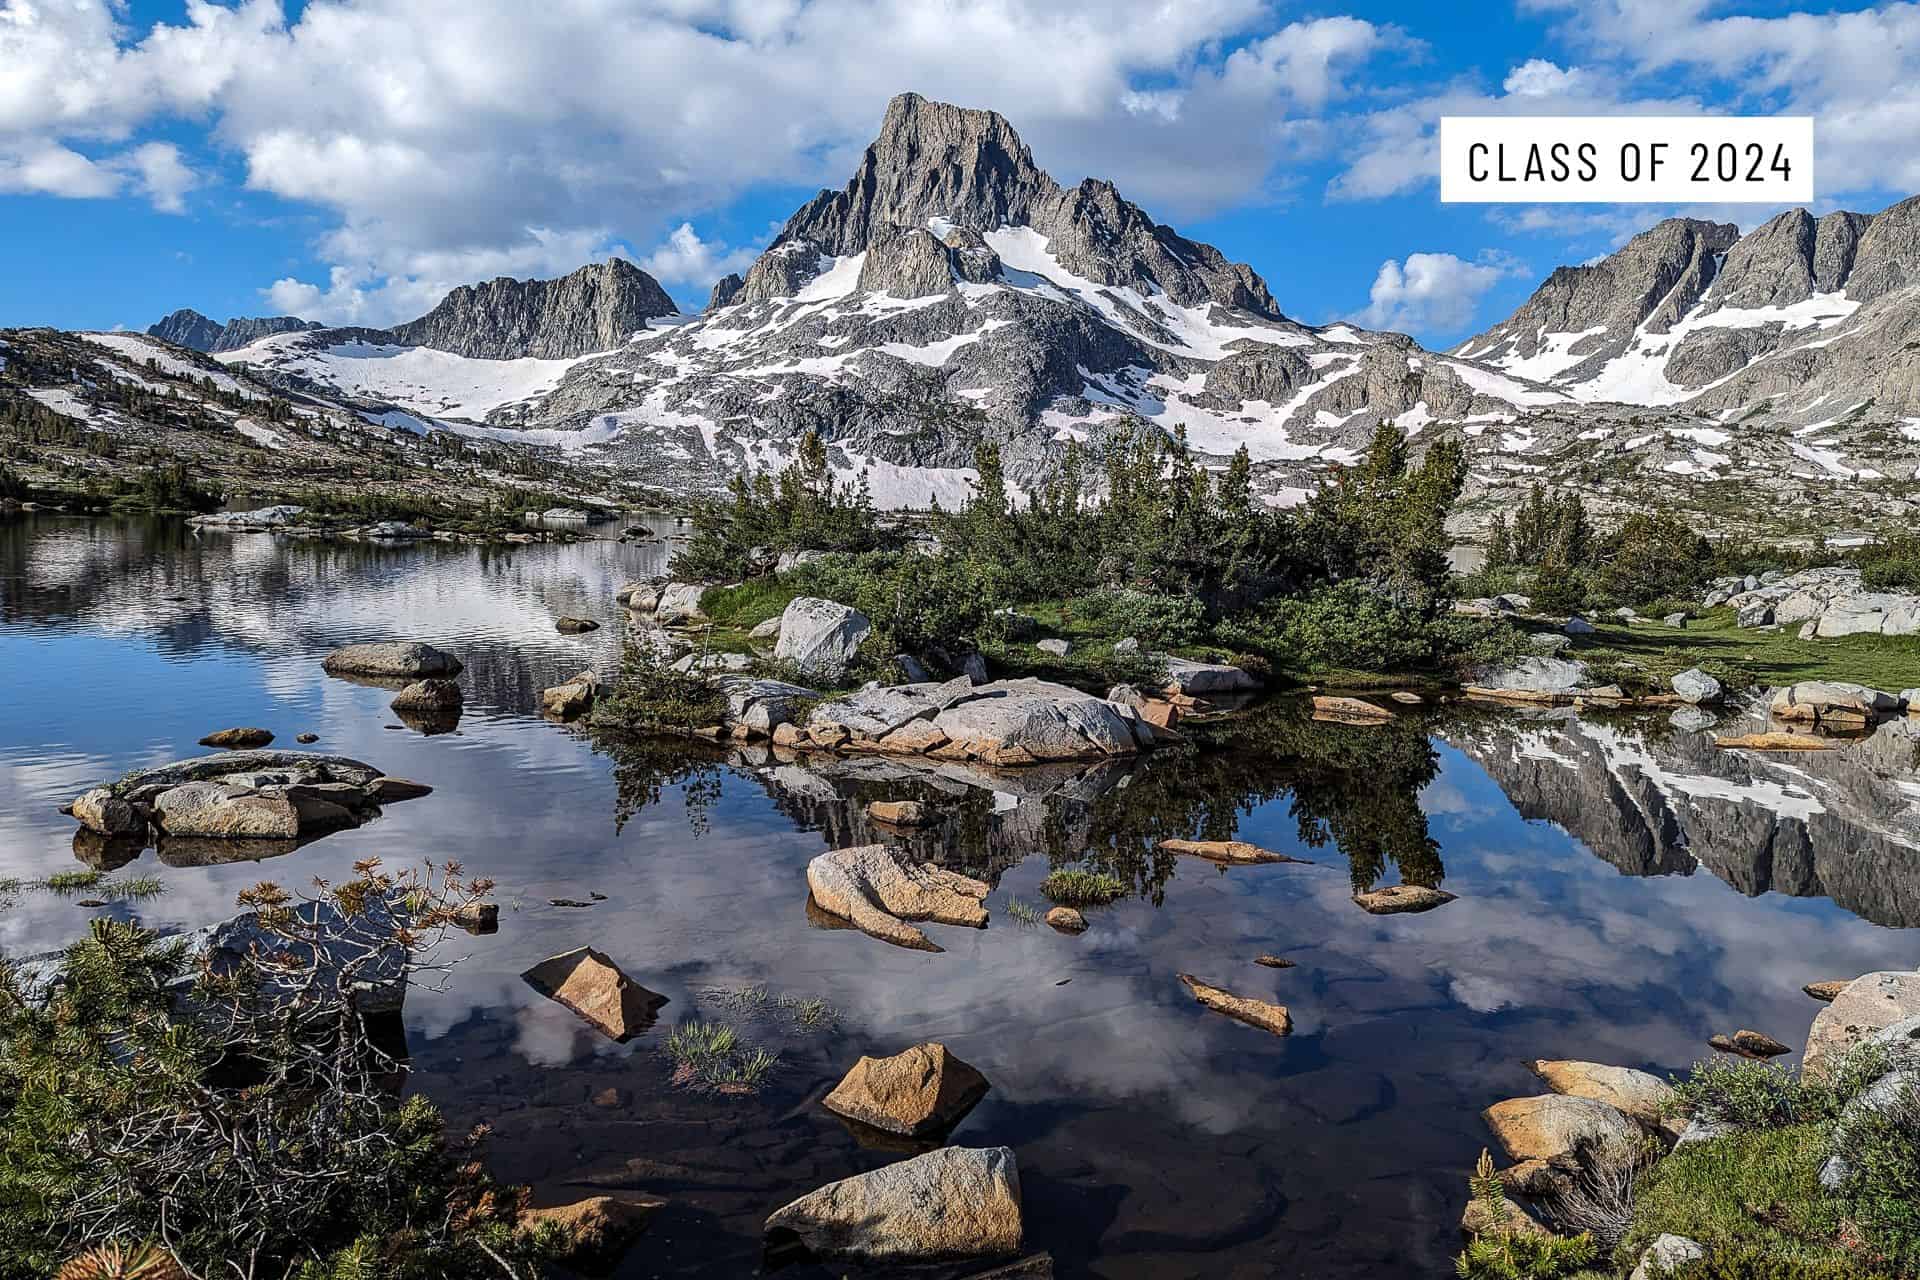
John Muir Trail Hiker Survey (2023)
The John Muir Trail Hiker Survey is distributed to JMT hikers at the end of the hiking season to capture a snapshot of the year’s class and provide a useful resource to future JMT hikers and recreators. A huge THANK YOU to everyone who took the time to participate and provide feedback.
This year’s survey is the most comprehensive yet, and I’ve devoted a tremendous amount of time to compiling the results. Again, the JMT Survey is meant to be a useful resource to help anyone interested in hiking the John Muir Trail figure out how to approach the seemingly monstrous journey. Every year, I try to improve the data collected and fine-tune the presentation to help hikers best. I would love to hear what you think in the comments below.
Congratulations on arriving at a spot in the JMT Survey most readers probably skip. Here are Halfway Anywhere’s 2023 John Muir Trail Hiker Survey results!

Notes on the Data
- There were 264 completed surveys. Sign up for the survey here if you’re hiking the John Muir Trail next year.
- Some responses have been sorted and colored (e.g., northbound vs. southbound responses).
- I ask that respondents do their best to respond accurately. Not everyone answers every question, and not every answer is 100% accurate (e.g., someone may mistakenly report their longest day of hiking was 21 miles instead of 18 miles).
- I refer to respondents collectively as the year’s “class.” Remember, this is a sample, not a comprehensive survey of every JMT hiker.
- For stats requiring the length of the John Muir Trail for a calculation (e.g., average mileage per day for the trail), I use 215.8 mi / 347.3 km. This is the distance, according to FarOut (which I recommend).
- I will release more detailed posts focused on JMT Gear, JMT Resupply, JMT Demographics, JMT Horror Stories, and JMT Advice. To be notified of new posts, click here.
Colors differentiating hiker segments:
- Thru-Hikers
- Northbound Thru-Hikers
- Southbound Thru-Hikers
- (1) is appended when using data from hikers who completed the trail
- (0) is appended when using data from hikers who did not complete the trail
If no color/label has been appended, I used all data collected.
Demographics
First, some John Muir Trail Class of 2023 data that won’t help anyone plan a thru-hike, but that’s interesting nonetheless: JMT hiker gender, age, race, education, sexual orientation, relationship status, and children.
JMT Hiker Gender
- 57.4% Male
- 42.2% Female
- 0.4% Non-Binary

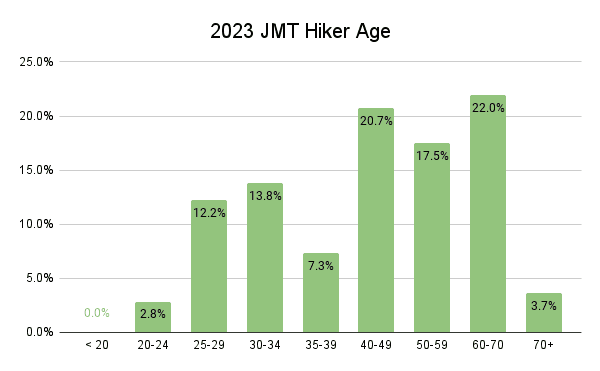
JMT Hiker Age
- 0% < 20
- 2.8% 20-24
- 12.2% 25-29
- 13.8% 30-34
- 7.3% 35-39
- 20.7% 40-49
- 17.5% 50-59
- 22% 60-69
- 3.7% 70+
Average age: 46
Median age: 45
σ: 14.5
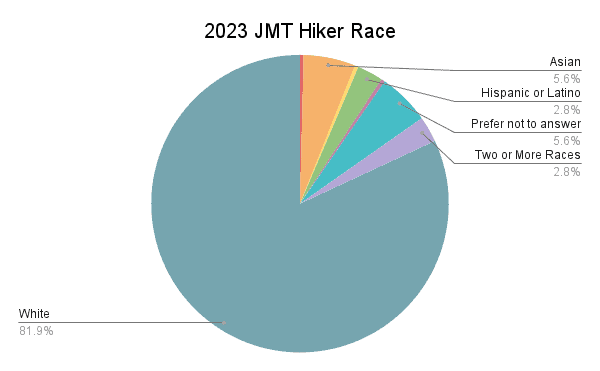
JMT Hiker Race
- 81.9% White
- 5.6% Asian
- 2.8% Hispanic or Latino
- 2.8% 2+ Races
- 0.4% Black or African American
- 0.4% American Indian or Alaska Native
- 0.4% Native Hawaiian or Pacific Islander
- 5.6% Prefer not to
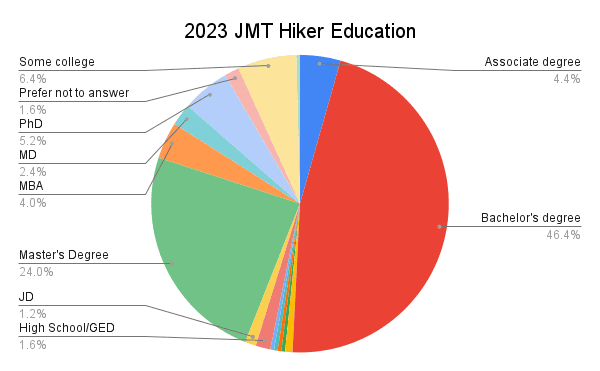
JMT Hiker Education
- 46.4% Bachelor’s degree
- 24.0% Master’s degree
- 6.4% Some college
- 5.2% PhD
- 4.4% Associate degree
- 4.0% MBA
- 2.4% MD
- 1.6% High school/GED
- 1.2% JD
- 0.8% 12th grade or less
- 0.4% BMS
- 0.4% DC
- 0.4% DNP
- 0.4% DVM
- 0.4% Trade school
- 1.6% Prefer not to answer
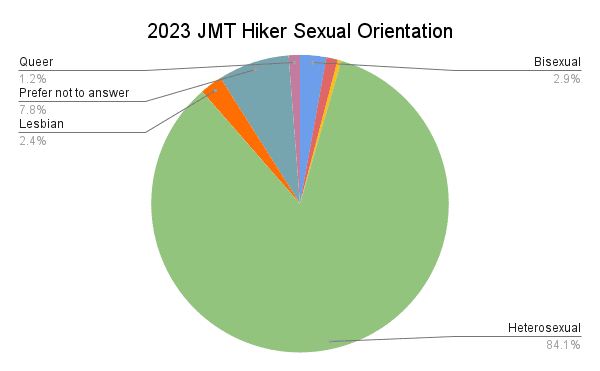
JMT Hiker Sexual Orientation
- 84.1% Heterosexual
- 2.9% Bisexual
- 2.4% Lesbian
- 1.2% Asexual
- 1.2% Queer
- 0.4% Gay
- 7.8% Prefer not to answer
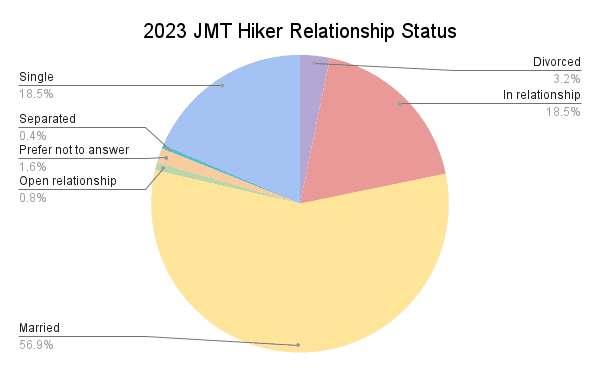
JMT Hiker Relationship Status
- 56.9% Married
- 18.5% In relationship
- 18.5% Single
- 3.2% Divorced
- 0.8% Open relationship
- 0.4% Separated
- 1.6% Prefer not to answer
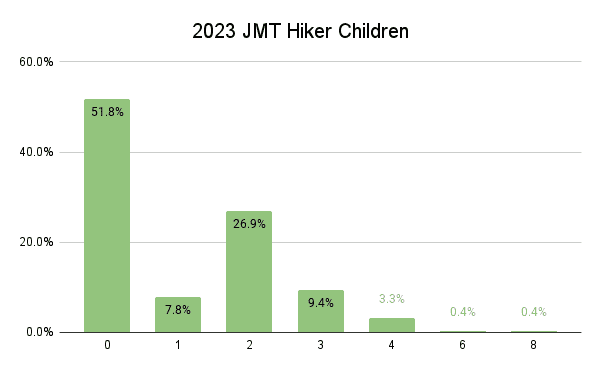
JMT Hiker Children
- 51.8% No children
- 7.8% One child
- 26.9% Two children
- 9.4% Three children
- 3.3% Four children
- 0.4% Six children
- 0.4% Eight children
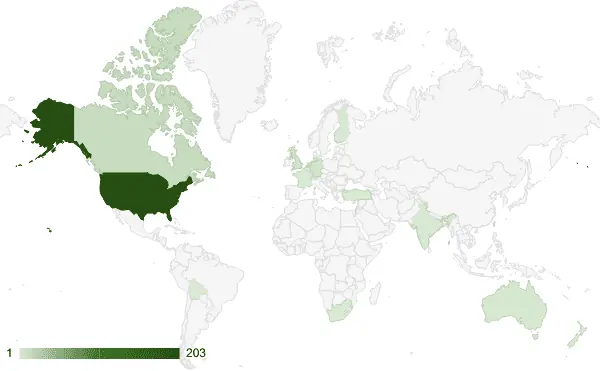
Where Hikers Are From
Every year, people come from all over the country and the world to hike the John Muir Trail. Here’s a look at where hikers on the trail this year were from.
- Countries: Australia, Bolivia, Canada, England, Finland, France, Germany, India, Israel, Netherlands, New Zealand, South Africa, Switzerland, Taiwan, Turkey, United Kingdom, United States (17 total)
- States & Territories: Alabama, Arizona, California, Colorado, Florida, Georgia, Hawaii, Idaho, Illinois, Kentucky, Louisiana, Maine, Maryland, Massachusetts, Michigan, Minnesota, Missouri, Nevada, New Hampshire, New Jersey, New Mexico, New York, North Carolina, Ohio, Oregon, Pennsylvania, Tennessee, Texas, Utah, Vermont, Virginia, Washington, Wisconsin (33 total)
A look at JMT hiker distribution across the world:
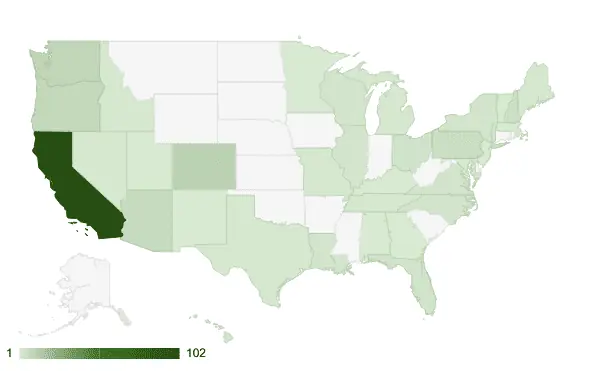
A look at JMT hiker distribution across the USA:
Most-Represented Countries
- United States 81.2%
- Canada 5.2%
- United Kingdom 2.8%
- Germany 2.4%
The Most-Represented States
- California 50.7%
- Colorado 5.5%
- Washington 4.5%
- Oregon 4.0%
- Arizona 3.5%
Hiker Jobs & Working Conditions
How can people take time off to hike the John Muir Trail? Yes, hiking it in less than a week is possible, but most people on the JMT want to take their time.
I asked hikers what they do for work and how they were able to take time off to hike the JMT.
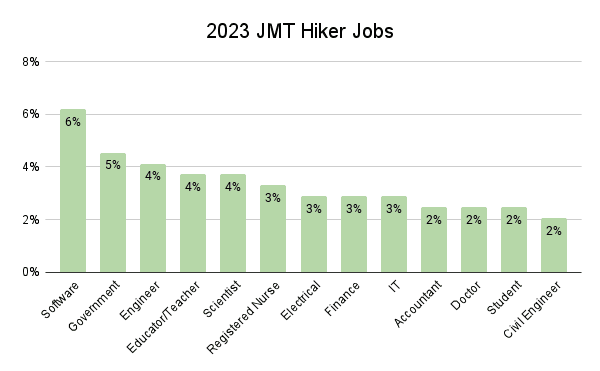
JMT Hiker Jobs
This year, hikers reported 81 different professions (the same as last year). The most common of which were:
- 6.2% Software Engineer
- 4.5% Government
- 4.1% Engineer
- 3.7% Educator/Teacher
- 3.7% Scientist
- 3.3% Registered Nurse
- 2.9% Electrical Engineer
- 2.9% Finance
- 2.9% IT
- 2.5% Accountant
- 2.5% Doctor
- 2.5% Student
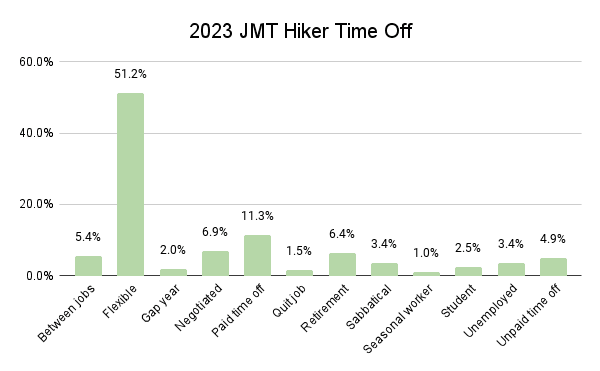
JMT Hiker Working Conditions
How was this year’s class able to take time off to hike the JMT?
- 51.2% Flexible work
- 11.3% Paid time off
- 6.9% Negotiated into employment
- 6.4% Retirement
- 5.4% Between jobs
- 4.9% Unpaid time off
- 3.4% Sabbatical
- 3.4% Unemployed
- 2.5% Student
- 2.0% Gap year
- 1.5% Quit job
- 1.0% Seasonal worker
Planning & Experience Levels
Here’s a look at what the John Muir Trail Class of 2023 looked like during the planning phase of their hikes. This section examines time spent planning, first-time hikers, hiker experience level, and other trails hiked.
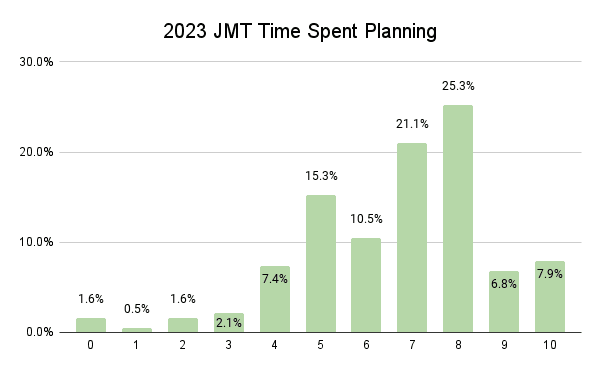
Time Spent Planning
I ask thru-hikers how much time they spend planning for their hikes on a scale of 0 (no time at all) to 10 (every waking moment).
- 0 – 1.6%
- 1 – 0.5%
- 2 – 1.6%
- 3 – 2.1%
- 4 – 7.4%
- 5 – 15.3%
- 6 – 10.5%
- 7 – 21.1%
- 8 – 25.3%
- 9 – 6.8%
- 10 – 7.9%
Average: 6.69
Median: 7
σ: 2.06
Hiking Experience
Instead of asking respondents if this would be/was their first long-distance hike, I asked the distance of their longest hike to date (pre-JMT). I used 100 mi / 160 km as the cutoff (sorry, Wonderland Trail hikers). If you want to yell at me for the arbitrary number I chose here (or suggest a better one), feel free to do so in the comments at the end of this post.
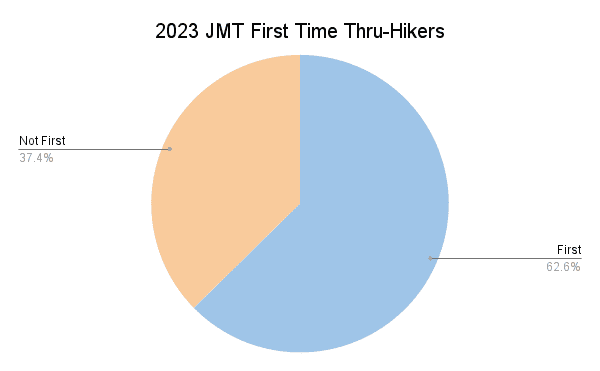
First Time Thru-Hikers
- 62.6% Yes
- 37.4% No
Average longest trail hiked: 199 mi / 320 km
Median: 73 mi / 117 km
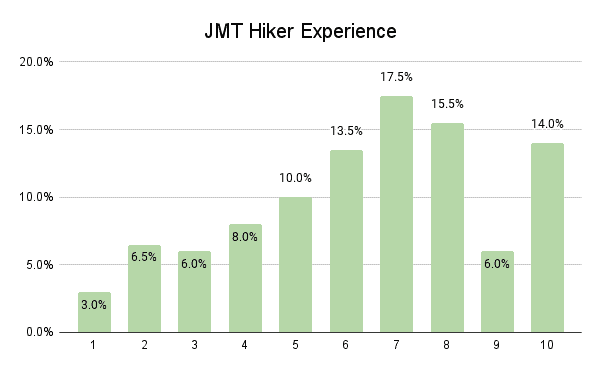
Hiker Experience Level
In addition to asking about the longest trail completed by thru-hikers pre-JMT, I ask thru-hikers to evaluate their backpacking experience on a scale of 1 to 10.
- Average experience: 6.38
- Median experience: 7
- σ: 2.54
Thru-Hikers (1): 6.48 | M = 7
Thru-Hikers (0): 5.80 | M = 6
Previous Trails Hiked
The trails most commonly hiked by those with experience were:
- 19.7% PCT Section Hike
- 14.1% AT Section Hike
- 12.7% John Muir Trail
- 12.7% Wonderland Trail
- 11.3% Tahoe Rim Trail
- 9.9% Colorado Trail
- 8.5% Appalachian Trail
- 7.0% Pacific Crest Trail
- 7.0% Camino de Santiago
- 7.0% Sierra High Route
- 5.6% CDT Section Hike
- 5.6% Arizona Trail
- 4.2% Coast to Coast Walk
- 4.2% GR20
- 4.2% Long Trail
- 2.8% Continental Divide Trail
- 2.8% Kungsleden
- 33.8% Other

Note: these percentages are for the hikers who have already completed a long-distance hike, not the entire class. Trails in the “Other” category only had a single hiker report each trail (there are many long-distance trails worldwide).
Pre-Hike Training
Next, we’ll look at whether thru-hikers trained in preparation for their thru-hikes, what they did (if anything) to train, and how thru-hikers rated their fitness (pre-JMT).
Did Hikers Train?
- 86.4% Yes
- 13.6% No

How Hikers Trained
- 35.4% Day hikes
- 22.6% Multi-day hikes
- 15.2% Running
- 6.7% Bicycling
- 5.5% Weight training
- 3.7% Stairs
- 3.0% Walking
- 2.4% CrossFit
- 1.2% Backcountry skiing
- 1.2% Mobility exercises
- 1.2% Step machine
- 0.6% Physical therapy
- 0.6% Swimming
- 0.6% Treadmill Incline

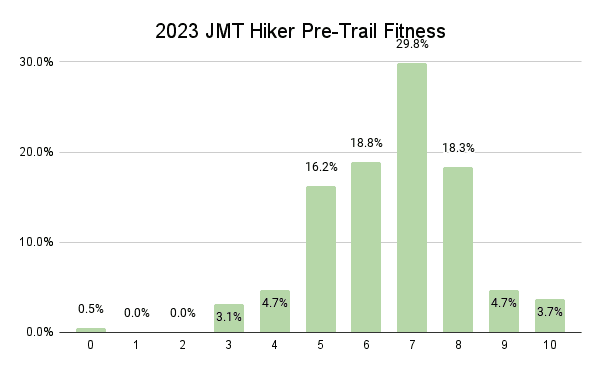
Pre-Trail Fitness Level
I asked thru-hikers to rate their fitness level (on a scale of 0 to 10) before beginning the trail.
- 0 – 0.5%
- 1 – 0.0%
- 2 – 0.0%
- 3 – 3.1%
- 4 – 4.7%
- 5 – 16.2%
- 6 – 18.8%
- 7 – 29.8%
- 8 – 18.3%
- 9 – 4.7%
- 10 – 3.7%
Average fitness: 6.57
Median fitness: 7
σ: 1.60
Thru-Hikers (1): 6.54 | M = 7
Thru-Hikers (0): 6.71 | M = 7
Money Spent on Hike
The question of how much money is required for a John Muir Trail thru-hike gets asked by many would-be JMT hikers each year – especially if they’re starting out with little or no gear.
Thru-Hikers (1)
$1,957
The average amount spent on the entirety of the JMT
M = $1,800 | σ = $1,223
Thru-Hikers (1)
$110
The average amount spent per day on the JMT
M = $93 | σ = $73
Thru-Hikers
$966
The average amount spent on gear before starting
M = $700 | σ = $912


Thru-Hikers (1)
$1,970
Average spent by domestic thru-hikers
M = $1,625 | σ = $1,233
Thru-Hikers (1)
$2,067
Average spent by international thru-hikers
M = $2,000 | σ = $1,147
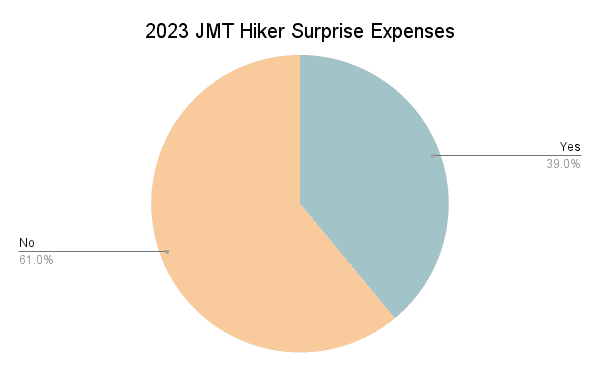
I asked John Muir Trail hikers if they encountered any unexpected expenses while hiking the JMT. Even if you purchase and test all your gear beforehand and pre-package all of your resupplies, you can’t predict what will happen during a JMT thru-hike.
Surprise Expenses Encountered
- 39% Yes
- 61% No
Unexpected expenses fell into three categories: gear replacement, hotel stays, and travel along the trail. However, hikers also reported towns being unexpectedly pricey and medical expenses in addition to these three bigger reasons.
Unexpected Expense Breakdown
32.3% Replacing gear
- 21.4% replacing failing gear
- 8.6% replacing hated gear
56.9% Hotel stays
- 35.7% due to weather
- 14.3% unexpected
- 1.4% due to injury
- 1.4% due to illness
7.7% Travel along the trail
- 2.9% due to weather
- 1.4% due to fires
- 1.4% due to injury
10.7% Other
- 9.2% Resupply was more expensive than expected
- 1.5% Medical expenses

Hiking Partners & Alone Time
Starting a long hike alone can be scary and intimidating, but many thru-hikers begin their hikes alone. Here, we’ll look at who hikers began with, how much time they spent hiking and camping alone, how often hikers cowboy camped, whether they stayed with their hiking partner(s), were in relationships, and their hiking group sizes.
JMT Hiker Starting Company
- 35.6% Alone
- 28% Began with a friend(s)
- 15.9% Began with a family member
- 18.2% Began with a partner or spouse
- 2.3% Arranged to start with other hiker(s) whom they had not met before beginning
Of this year’s first-time thru-hikers, 34% began their hikes alone.

Time Hiking Alone
- 33.0% – 0
- 11.7% – 1-10
- 5.7% – 11-20
- 5.3% – 21-30
- 1.5% – 31-40
- 4.5% – 41-50
- 1.9% – 51-60
- 4.2% – 61-70
- 5.7% – 71-80
- 7.2% – 81-90
- 8.7% – 91-99
- 10.6% – 100
39% – Average time thru-hikers spent hiking alone
σ = 40% | M = 20%

“Hiking alone” measures how long hikers weren’t physically walking with someone down the trail. It does not necessarily imply they weren’t hiking with others throughout the day (i.e., camping with others).
Time Camping Alone
- 53.1% – 0
- 6.5% – 1-10
- 3.8% – 11-20
- 2.7% – 21-30
- 2.7% – 31-40
- 2.7% – 41-50
- 1.9% – 51-60
- 1.2% – 61-70
- 7.3% – 71-80
- 3.5% – 81-90
- 2.7% – 91-99
- 11.9% – 100
σ = 39 | M = 0

28.1% was the average percentage of nights thru-hikers spent camping alone (σ = 37 | M = 0). For thru-hikers (1), this translates to an average of 5 nights camping alone.
Nights Cowboy Camping
- 95.4% – 0
- 3.1% – 1-10
- 0.8% – 11-20
- 0.4% – 21-30
- 0.0% – 31-40
- 0.0% – 41-50
- 0.0% – 51-60
- 0.4% – 61-70
- 0.0% – 71-80
- 0.0% – 81-90
- 0.0% – 91-99
- 0.0% – 100
σ = 5 | M = 0

0.004% was the average percentage of nights thru-hikers spent cowboy camping (σ = 2.4 | M = 0). Looking at thru-hikers (1), this translates to an average of zero nights of cowboy camping.
Hiking Partner(s)
Beginning a hike with someone is one thing, but remaining together and finishing it with someone is arguably as impressive as the trail itself. Here’s how things worked out for those who began their hikes with another person.
Remaining with Partner(s)
- 83.2% Yes
- 5.4% No, partner got off the trail
- 6.0% Yes, for the most part
- 4.8% No, it wasn’t for the best
- 0.6% No, no longer friends

Size of Hiking Groups
Although most hikers begin their John Muir Trail hikes alone, most eventually link up and hike with at least one other person for a considerable amount of their time on the JMT. Some hikers refer to this as a trail family or “tramily. ” Here are the largest groups hikers found themselves hiking with regularly.
Average group size: 2.5
Median size: 2
σ: 3.1

Starting Conditions & Permits
Getting a John Muir Trail permit can be the first obstacle for many hikers. For 2024, permit registration takes place via a weekly lottery on Recreation.gov.
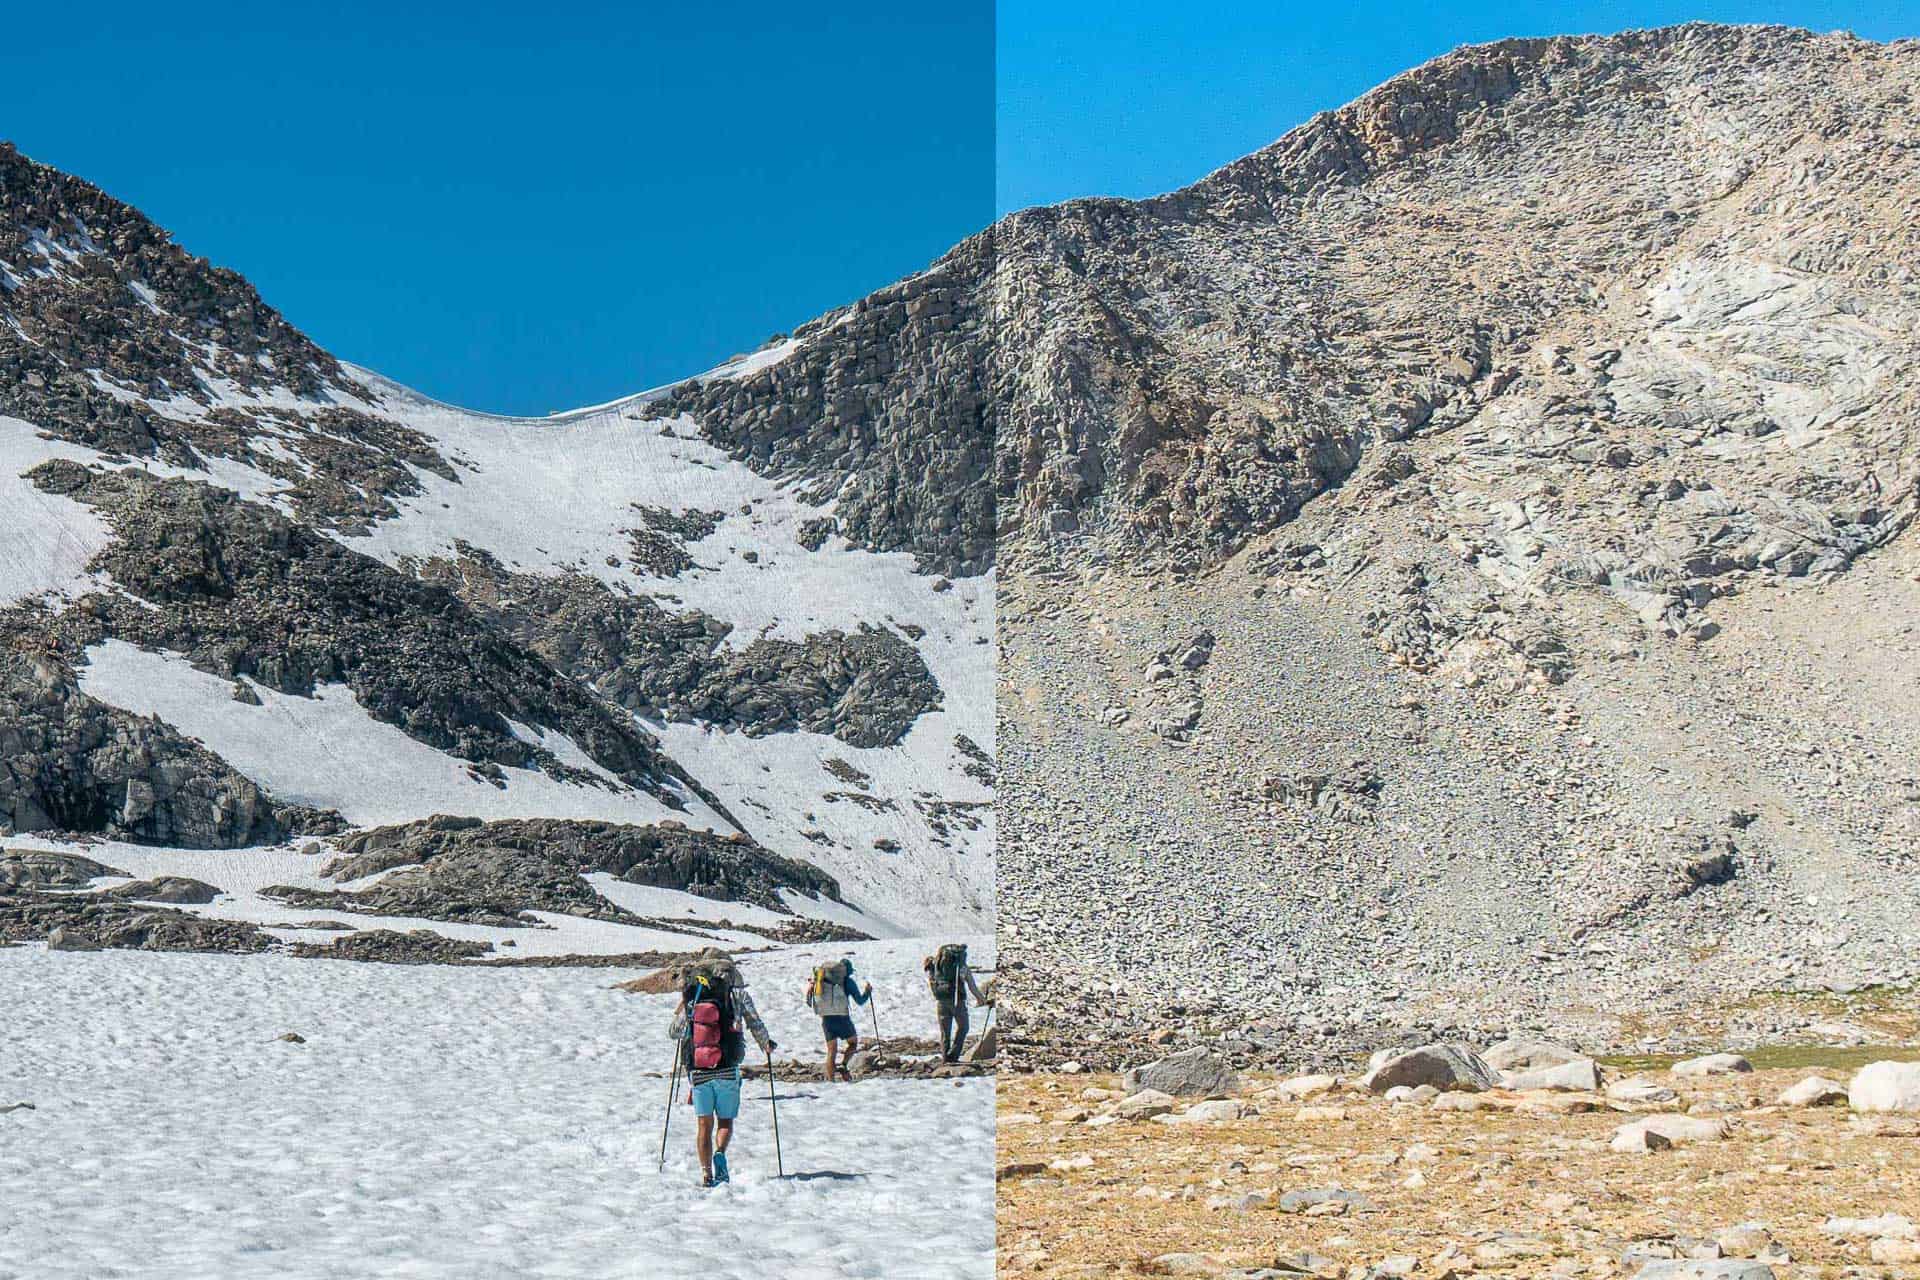
When to begin the JMT is a question of debate every year. Depending on when you’re traveling through the Sierra, there could be snow, bugs, or fires; gauging when to hit the JMT can be tricky.
Here, we look at permit dates, direction hiked, why some hikers went northbound, starting months, and starting locations.
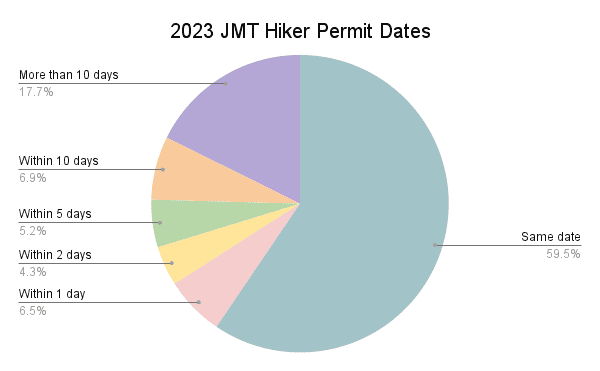
Permit Start Dates
- 59.9% Received permit for the date wanted
- 6.5% +/- 1 day
- 4.3% +/- 2 days
- 5.2% +/- 5 days
- 6.9% +/- 10 days
- 17.7% > 10 days
Hiking Direction
- 62.5% Southbound
- 37.5% Northbound

Hiker Start Months


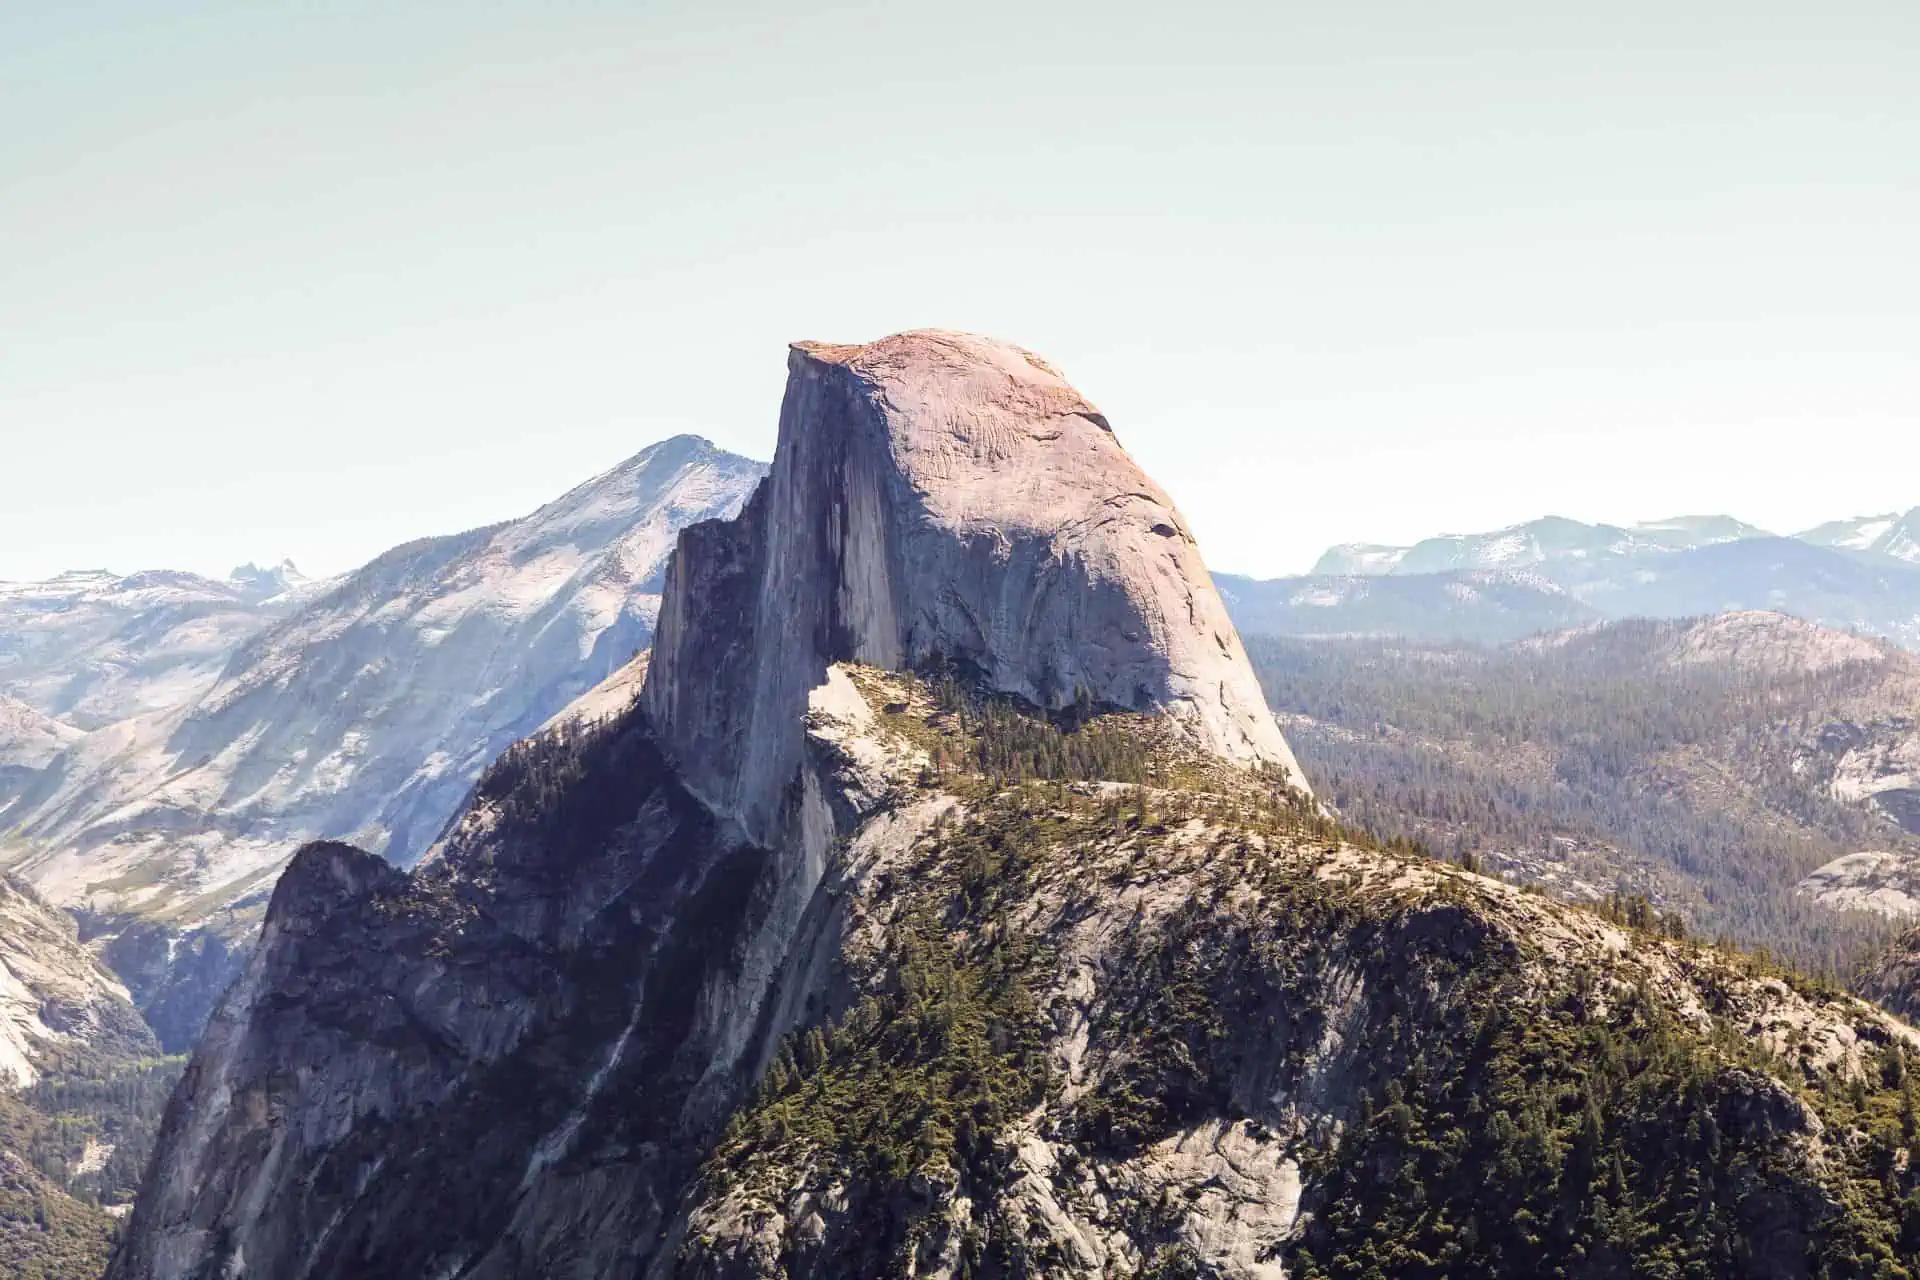
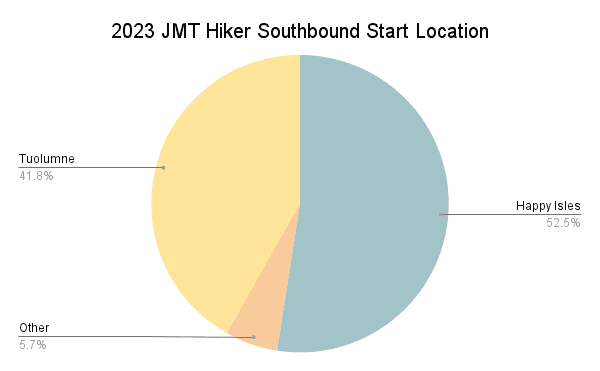
The John Muir Trail is traditionally hiked southbound – beginning at Happy Isles Trailhead in Yosemite National Park and ending at Whitney Portal Trailhead in Inyo National Forest.
However, with more competition for permits and due to personal circumstances or logistics, many hikers have started to explore alternatives to the traditional route. This could mean either beginning elsewhere in Yosemite or hiking the trail northbound.
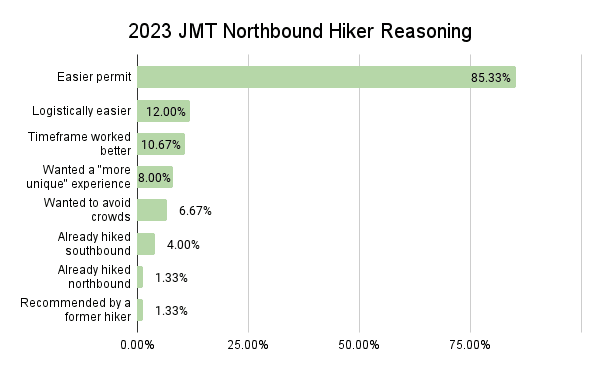
Northbound Hiker Reasoning
- 85.3% – Easier permit
- 12.0% – Logistically easier
- 10.7% – Timeframe worked better
- 8.0% – Wanted a “more unique” experience
- 6.7% – Wanted to avoid crowds
- 4.0% – Already hiked southbound
- 1.3% – Already hiked northbound
- 1.3% – Recommended by a former hiker
Most northbound JMT hikers began their hikes at Horseshoe Meadow via the Cottonwood Pass Trailhead or New Army Pass (via the Cottonwood Lakes Trailhead). However, for those lucky enough, getting a permit for the Whitney Portal Trailhead is possible via the Mount Whitney lottery.

Hiking Stats
In this section, we look at a breakdown of hike lengths and averages and a look at how many days hikers took off (zero days) or did very few miles (nearo days).
Length of Thru-hikes
Thru-Hikers (1)
19.0
The average number of days of an entire thru-hike
M = 18 | σ = 6.1
Thru-Hikers (1)
17.8
The average number of days hiking (total minus zero days)
M = 17 | σ = 5.8
Thru-Hikers (1)
12.3
The average daily mileage (19.8 km)
σ = 4.0 mi / 6.4 km
Thru-Hikers (1)
13.1
The average daily mileage after removing zero days (21.1 km)
σ = 3.9 mi / 6.9 km
Thru-Hikers (1)
19.1
The average longest day of hiking (30.7 km)
M = 18 mi / 29 km
σ = 3.9 mi / 6.9 km
Zero and Nearo Days (i.e., Days Off)
Thru-Hikers (1)
1.2
The average number of zero days (days off from hiking)
(M = 1 | σ = 1.5)
Thru-Hikers (1)
0.9
The average number of nearo days (low mileage days)
(M = 1 | σ = 0.9)
Thru-Hikers (1)
1.6
The average longest consecutive number of zero days
(M = 1 | σ = 1.3)
Alternate Routes
The John Muir Trail is well-defined, but there are several alternates (sometimes also known as “shortcuts”) hikers can take either in place of or in addition to the official JMT. I ask about these alternates to get an idea of what the most common JMT thru-hike looks like. Alternates are listed in geographical order from north to south.
The following colors indicate the popularity of each alternate (the percentage of hikers who reported taking each): over 75%, 50-75%, 25-50%, less than 25%.
- Tuolumne Campground Trail 6.0%
- Pacific Crest Trail (between Thousand Island Lake and Agnew Meadows) 6.0%
- Devils Postpile Trail 38.9%
- Mammoth Pass Trail 4.8%
- Duck Pass Trail 4.8%
- Cascade/Fish Valley Trail 0.6%
- Goodale Pass Trail (in and/or out of VVR) 4.8%
- Bear Ridge Trail (in and/or out of VVR) 23.4%
- Bear Creek Trail (in and/or out of VVR) 2.4%
- Blayney Meadows Trail 1.2%
- Piute Pass Trail (to/from North Lake) 18.6%
- Bishop Pass Trail (to/from South Lake) 18.6%
- Taboose Pass Trail 0.6%
- Kearsarge Pass Trail (to/from Onion Valley) 48.5%
- Shepherd Pass Trail 0.6%
- Old Army Pass Trail (to/from Horseshoe Meadow) 0.6%
- New Army Pass Trail (to/from Horseshoe Meadow) 6.0%
- Cottonwood Lakes/Army Pass Trail (to/from Horseshoe Meadow) 2.8%
- Cottonwood Pass Trail (to/from Horseshoe Meadow) 25.8%
- Trail Pass Trail (to/from Horseshoe Meadow) 0.6%
Not an alternate, but instead the official destination of a traditional southbound JMT thru-hike, Mount Whitney is not an objective that all JMT hikers find themselves atop. Here’s a look at the number of thru-hikers who summited the highest peak in the Continental United States and why some decided to skip it.
Summit Mount Whitney
- 73% Yes
- 27% No

Why Hikers Didn’t Summit
- 35.19% Didn’t make it that far
- 31.48% Already summited
- 29.63% Weather
- 11.11% Snow concerns
- 9.26% Altitude issues
- 7.41% Partner didn’t want to
- 5.56% Behind schedule
- 1.85% Skipped that section
- 1.85% Smoke
- 1.85% No interest

Note: these percentages are for the hikers who did not summit Mount Whitney, not the entire class.
JMT Completion Rates
Most people who begin a John Muir Trail thru-hike intend to complete the trail. Unfortunately, not everyone who sets out on this epic adventure finishes. Many people hoping to hike the JMT fail to complete the trail yearly.
Thru-Hikers
83%
The percentage of thru-hiker respondents who completed the JMT.
Northbound
87%
The percentage of northbound thru-hiker respondents who completed the JMT.
Southbound
82%
The percentage of southbound thru-hiker respondents who completed the JMT.
Why JMT Hikers Didn’t Finish
- 28.1% Weather
- 25.0% Snow
- 15.6% Injury
- 12.5% Personal
- 3.1% Family
- 3.1% Gear Failure
- 3.1% Illness
- 3.1% Logistical
- 3.1% Stream Crossings
- 3.1% Work

Note: these percentages are for the hikers who did not complete the trail, not the entire class.
Miles Completed by Hikers
- 9.1% – 0-25
- 12.1% – 25-50
- 12.1% – 50-75
- 9.1% – 75-100
- 18.2% – 100-125
- 15.2% – 125-150
- 18.2% – 150-175
- 6.1% – 175-200
Average: 107.3 mi / 172.7 km
Median: 115 mi / 185 km

On-Trail Issues
On a scale of 1 to 10, I asked thru-hikers how much of an issue each of the following was during their hikes.
- 4.3 – Mosquitoes
- 3.36 – Streams
- 3.27 – Rain/Hail
- 3.26 – Snow
- 2.73 – Storms
- 2.46 – Elevation
- 2.33 – Cold
- 1.93 – Wind
- 1.71 – Heat
- 0.37 – Rodents
- 0.23 – Smoke/Fires
- 0.18 – Bears

Resupply
The word “resupply” can be anxiety-inducing if you’re new to the idea of a thru-hike. What is resupply? Where does it come from? How much of it is there? How do you get it? Will it hurt?
Basically, resupply is getting yourself more food to power more hiking. Nothing that needs to be too scary or intimidating. Resupply on a John Muir Trail is fairly straightforward since you only have so many options as far as getting yourself more calories to carry in your bear canister (yes, please bring and use a bear canister – it’s required), but when and where hikers resupply is still a question many find quite scary.
Here we have this year’s resupply stats, resupply strategy/boxes, resupply box suggestions, where hikers resupplied, favorite and least favorite resupply stops, favorite meals and snacks, and resupply advice.
JMT Resupply Stats
Thru-Hikers (1)
2.6
The average number of resupplies over the trail
(M = 3 | σ = 1.2)
Thru-Hikers (1)
8.1
The average number of days between resupplies
(M = 8 | σ = 2.3)
Thru-Hikers
2.1
The average number of resupply boxes sent
(M = 2 | σ = 1.8)
Thru-Hiker Resupply Boxes
- 0 – 10.3%
- 1 – 24.8%
- 2 – 29.7%
- 3 – 29.1%
- 4 – 5.5%
- 5 – 0.6%

Where to Send Resupply Boxes
I asked hikers where, if anywhere, they would highly recommend mailing a resupply box. The following percentages are based on answers from the 87% of thru-hikers (1) who recommend sending at least one resupply box.
- Muir Trail Ranch 47%
- Red’s Meadow 46%
- Vermilion Valley Resort (VVR) 40%
- Independence 26%
Where Hikers Resupplied
I ask hikers to report where they resupply – not where they stopped/passed through, but where they purchased, picked up, were given, or otherwise came into a new food stock.
Locations are listed in geographical order from north to south. Again, I used the following colors to indicate each resupply stop’s popularity: over 75%, 50-75%, 25-50%, less than 25%.
- Tuolumne Meadows 3.5%
- Lee Vining 0.6%
- Red’s Meadow 52.1%
- Mammoth Lakes 14.4%
- Vermilion Valley Resort (VVR) 38.9%
- Muir Trail Ranch 53.2%
- Bishop (via Piute Pass/North Lake) 10.2%
- Bishop (via Bishop Pass/South Lake) 7.8%
- Bishop (via Kearsarge Pass/Onion Valley) 3.6%
- Onion Valley 3.6%
- Independence (via Kearsarge Pass/Onion Valley) 46.1%
- Onion Valley Pack Station 3.4%
- Charlotte Lake (resupply delivered) 1.8%
- Bishop (via Horseshoe Meadow) 1.8%
- Independence (via Horseshoe Meadow) 1.8%
Favorite & Least Favorite Resupply Stops
Now we know the most popular stops for resupplying and sending boxes, but what about hikers’ favorite and least favorite resupply stops?
Favorite Resupply Stop
Vermilion Valley Resort (VVR)
60% of hikers voted for VVR
Least Favorite Resupply Stop
Muir Trail Ranch
33% of hikers voted for MTR
Favorite Meals & Snacks
As part of my quest for better backpacking meals, I asked John Muir Trail hikers to share their favorite sources of calories on the trail. More on this will be in the JMT Resupply Guide.
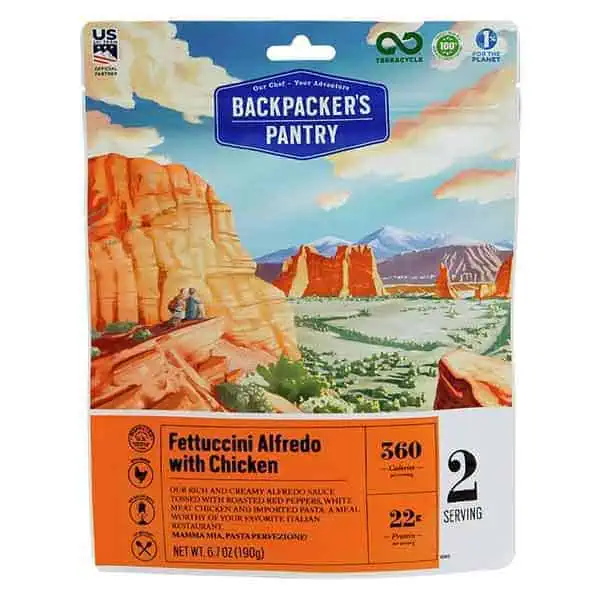
Favorite Backpacking Meals
- Backpacker’s Pantry 35.1%
- Mountain House 30.3%
- Peak Refuel 20%
- Good To-Go 11.5%
- AlpineAire Foods 10.9%
- Knorr Rice Sides 7.9%
- Packit Gourmet 6.7%
- Heather’s Choice 3.6%
- Greenbelly Meals 3%
- Patagonia Provisions 2.4%
Favorite Backpacking Snacks
- Trail Mix 30.7%
- Beef Jerky 24.8%
- Peanut Butter 23.8%
- Snickers Bars 23.8%
- M&M’s 22.9%
- Honey Stinger Waffles 22%
- Clif Bars 19.1%
- Pro Bars 15%
- Almonds 12.2%
- Pop-Tarts 10.3%

Resupply Changes
Hindsight is 20/20 (unless you’re looking back through the darkness for that mountain lion you think might be following you – but that’s likely a deer). Here is what hikers said they would change about their resupply strategies if they could do it all over again. These don’t change much yearly, so I highly encourage you to heed this advice when considering your resupply options.
- Send less food in boxes (42.3%)
- Send more variety in boxes (31.3%)
- Resupply less frequently (12.9%)
- Send healthier food in boxes (12.3%)
- Resupply more frequently (11.7%)
*The average number of resupplies by hikers who said they would have liked to have resupplied less frequently was 2.6; for those who wanted to resupply more frequently, this number was 1.5.
Thru-Hikers
3.6%
The number of thru-hikers who went stoveless for the entirety of their hikes.
I’ll follow up on this article with a more detailed breakdown of this year’s JMT resupply. If you would like to be notified of new posts, click here.
Thru-Hiking Gear
John Muir Trail hikers spend a lot of time deciding on their gear. Gear choices are essential in a thru-hike, but no magical gear combination will guarantee success. I will do a deep dive into JMT hiker gear, but the following will give a taste of the gear choices and what’s to come.
Let’s look at what this year’s JMT Class had with them out on the trail.
Thru-Hikers
24.3 lb
Average pre-hike base weight (11.022 kg)
(M = 22 lb / 9.98 kg)
Thru-Hikers (1)
22.9 lb
Average post-hike base weight (10.39 kg)
(M = 21 lb / 9.53 kg)
Thru-Hikers (1)
-1.19 lb
Average total change in base weight (540 g)
(M = 0)
Thru-Hikers
56.9 L
Average backpack size
(M = 60)
Thru-Hikers
18.1°F
Average sleeping bag rating (-7.7°C)
(M = 20°F / -6.6°C)
Thru-Hikers
5.8%
Number of hikers who used a foam sleeping pad
More detailed and interesting breakdowns of this information are in this year’s JMT Gear Guide. Let’s peek at some of the gear thru-hikers were using on the trail this year. Here are the most common “Big 4” items: packs, shelters, sleeping bags/quilts, and sleeping pads (I know it’s the “Big 3”, but I include sleeping pads; get over it) along with the most common insulated jackets and shells.
This is just the tip of the proverbial thru-hiking iceberg in the gear department. As mentioned above, I will soon be publishing a detailed breakdown of this year’s JMT gear. This will include the all-important shoes, snow gear, luxury items, what hikers didn’t like about their gear, what gear decisions (might have) helped hikers to a successful thru-hike, how hikers would change/adapt their gear for a future hike, and more.
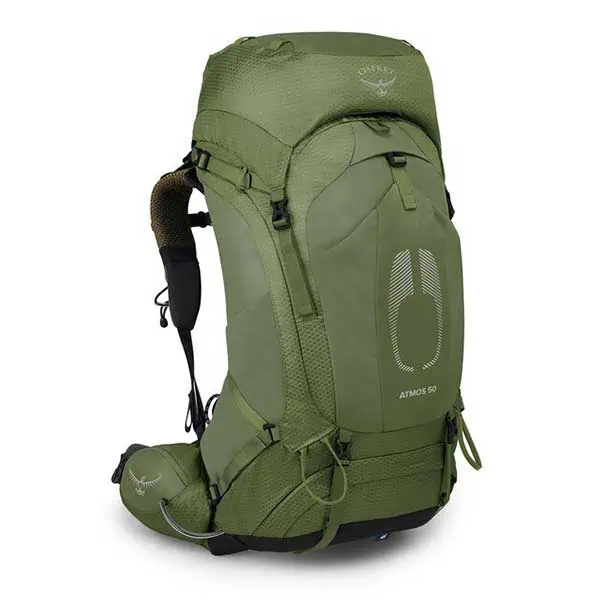
Most Common JMT Backpacks
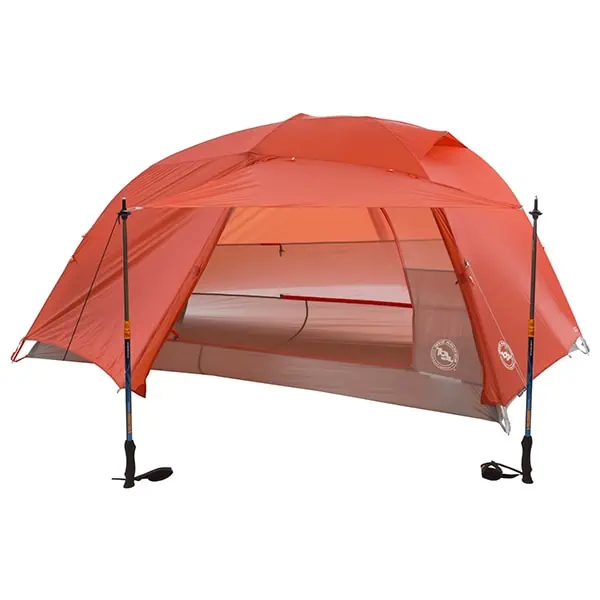
Most Common JMT Shelters
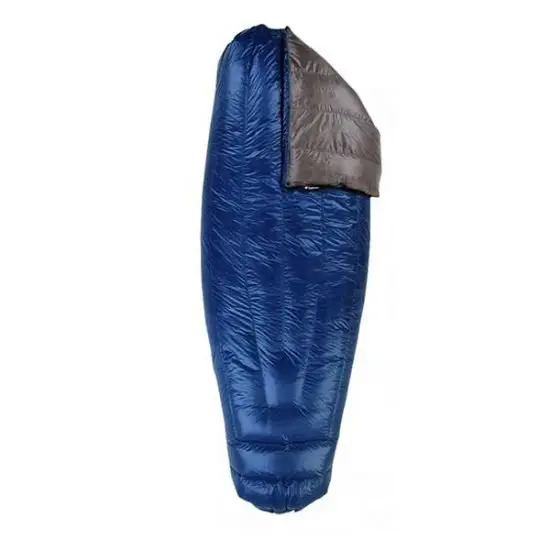
Most Common JMT Sleeping Bags/Quilts
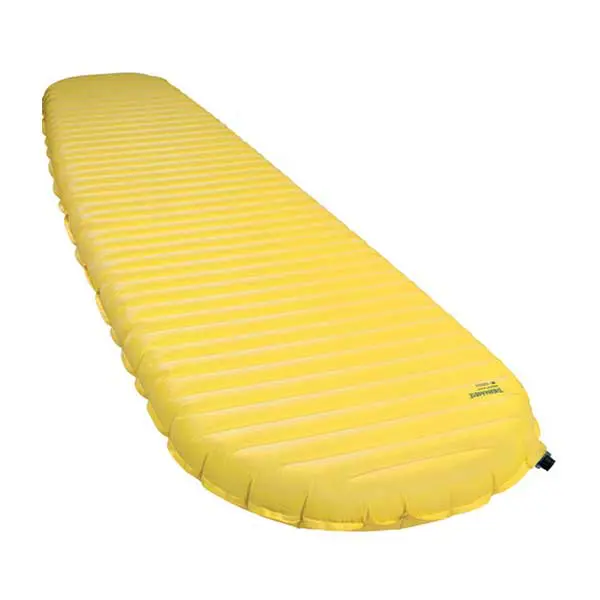
Most Common JMT Sleeping Pads
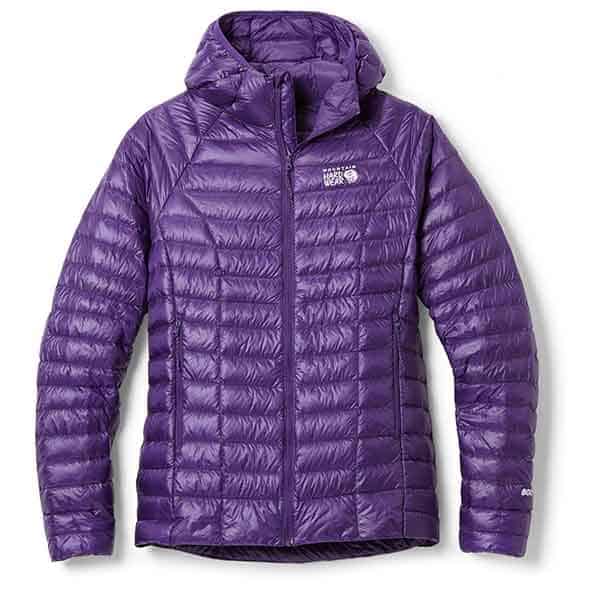
Most Common JMT Insulated Jackets
- Mountain Hardwear Ghost Whisperer/2 Hoody (Men’s/Women’s)
- Arc’teryx Cerium Hoody (Men’s/Women’s)
- Patagonia Down Sweater (Men’s/Women’s)
- REI Co-op 650 (Men’s/Women’s)
- Enlightened Equipment Torrid (Men’s/Women’s)
- Patagonia Nano Puff Jacket (Men’s/Women’s)
- Mountain Hardwear Ghost Whisperer/2 (Men’s/Women’s)
- Patagonia Micro Puff Hoody (Men’s/Women’s)
- Decathlon Forclaz Trek 100 (Men’s/Women’s)
- Rab Microlight Alpine Jacket (Men’s/Women’s)
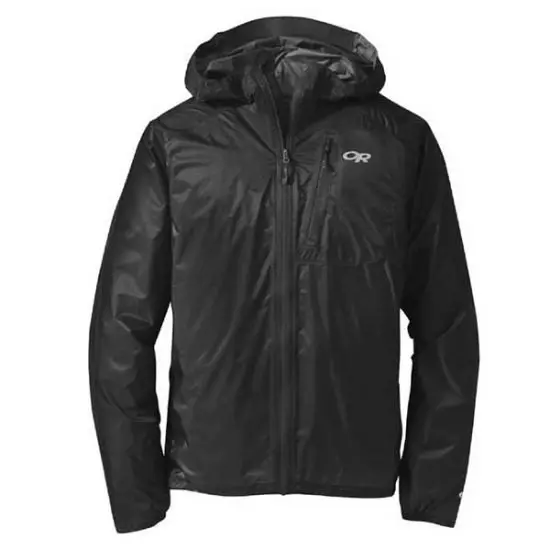
Most Common JMT Shells
- Outdoor Research Helium (Men’s/Women’s)
- Frogg Toggs Ultra-Lite2
- Montbell Versalite (Men’s/Women’s)
- REI Essential Rain Jacket (discontinued)
- Arc’teryx Beta (Men’s/Women’s)
- Marmot PreCip Eco (Men’s/Women’s)
- Patagonia Torrentshell 3L (Men’s/Women’s)
- The North Face Venture 2 (Men’s/Women’s)
- Columbia OutDry Featherweight (Men’s/Women’s)
- Lightheart Gear Rain Jacket
For more on gear, check out more of the best backpacking gear.
Technology on Trail
Gone are the days of the John Muir Trail requiring everyone to navigate with a paper map and compass using sketches from former hikers to identify landmarks. That said, a map and compass aren’t necessarily terrible things to have with you; many would never leave home without them. But the reality is that there are apps available to JMT hikers, and there’s no reason you shouldn’t take advantage of the tools available.
Here are the phones and apps hikers were using out on the trail this year.
Phone Carried
- 68.1% iPhone
- 31.1% Android
- 0.4% Flip phone
- 0.4% Didn’t carry phone

JMT Hiker Apps
- 65.7% FarOut Guides
- 35.1% Gaia GPS
- 23.1% Garmin Explore App
- 21.2% CalTopo
- 15.1% AllTrails
- 7.6% Google Maps
- 7.2% Peak Finder
- 4.0% Maps.me
- 3.2% Strava
- 1.6% Avenza Maps
- 1.6% Seek by iNaturalist
- 1.2% Hiking Project
- 1.2% Merlin
- 1.2% Komoot
- 0.4% Backcountry Navigator
- 3.1% Other
- 5.6% Didn’t use any apps

Hiker Health & Water Sources
Water treatment and personal hygiene are (or should be) big considerations for hikers. Typically, thru-hikers worry less about these as the trail goes on, but experience isn’t always your friend.
Some hikers religiously filter all water that passes through their face hole – it doesn’t matter if it comes out of a hotel sink or a puddle with a cow pooping in it. Other hikers will “not filter above 10,000 ft / 3,048 m” or “not filter running water” (this last one is not a good idea – running water can 100% get you sick).
Everyone wants to look cool in front of their friends by not filtering water (note: not filtering your water does not make you cool), but there are risks to the badass thru-hiker lifestyle (and drinking dirty, giardia-infested water).
To find out how good a job everyone is doing filtering their water and sanitizing their hands after pooping (another way to get yourself sick), I ask hikers if they got sick (defined as 3+ days of digestive issues or diagnosed giardia), how often they treated water sources, and how these two things compare to one another.
JMT Hiker Illness
- 97% Didn’t get sick
- 3% Got sick

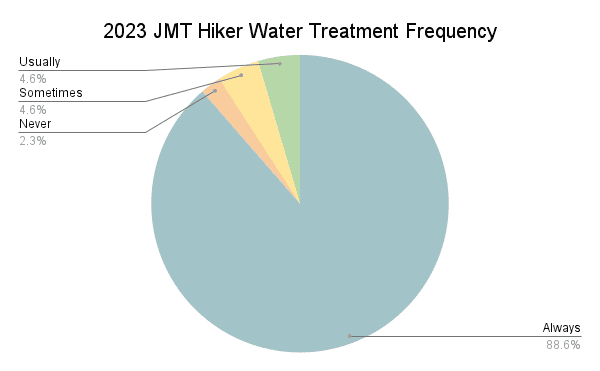
Water Treatment Frequency
- 88.6% Always
- 4.6% Usually
- 4.6% Sometimes
- 2.3% Never
Treatment vs. Illness
- 0.9% Always treated, got sick
- 89.6% Always treated, never got sick
- 0.9% Usually treated, got sick
- 8.1% Usually treated, never got sick
- 0.5% Sometimes treated, never got sick

Looking at this another way, we can see the following.
- 88.6% of hikers always treated their water, and 2.6% of these hikers got sick
- 4.6% of hikers usually treated their water, and 0% of these hikers got sick
- 3.6% of hikers sometimes treated their water, and 9.1% of these hikers got sick
- 2.3% of hikers never treated their water, and 20% of these hikers got sick
In total, a reported 3.0% of hikers came down with something akin to (or diagnosed) giardia.
Favorite/Least Favorite Sections
The John Muir Trail is a relatively long hike with a lot to see (mostly bears). Here is a look at the favorite and least favorite sections of the trail.
Favorite JMT Sections
- Glen Pass to Forester Pass 33.3%
- Donohue Pass to Thousand Island Lake 26.7%
- Forester Pass to Crabtree Meadow 26.7%
- Bear Ridge Trail 3.3%
- Crabtree Meadow to Guitar Lake 3.3%
- Devils Postpile/Red’s Meadow 3.3%
- Garnet Lake to Red’s Meadow 3.3%

Least Favorite JMT Sections
- Bear Ridge Trail 18.6%
- Whitney Portal Trail 17.3%
- Yosemite Valley to Tuolumne Meadows 12.2%
- Devils Postpile/Reds Meadow to Silver Pass 9.6%
- Pinchot Pass to Glen Pass 9.6%
- Bear Creek Trail 7.7%
- Garnet Lake to Reds Meadow 7.1%

Fear, Regrets, and Advice
When asked if hikers ever felt legitimately afraid on the trail, this is what they had to report. If you’ve never experienced a thunderstorm directly overhead while in the mountains above treeline, you may be surprised at how much more threatening it is than watching that same storm through a window while warm inside your car or home.
- When I squared off with a bear.
- Waterfalls were everywhere, and the stream/river crossings were difficult because of all the water. We knew three more days of rain were expected.
- Mega lightning storm while camped at Sallie Keyes.
- On my last night on the trail, a lightning storm rolled in when I was just below Cloud’s Rest. I tried to put up my tent, but the poles broke. It was getting colder, and lightning was crashing all around while I huddled in a half-formed tent, soaked through. The rain stopped, and I had the chance to fix up my tent, but it would have been a very rough night if the rain had kept going.
- I was hiking alone almost 100% of the time and got pretty spooked about running into cats and bears.
I’ll follow up on this article with a more comprehensive accounting of this year’s JMT scariest moments. If you would like to be notified of new posts, click here.
Now for John Muir Trail thru-hiker wisdom. I asked hikers what they would have done differently before their hikes if they were to do it all over again.
Pre-Hike Changes
- 30.5% – Dialed in food
- 25.5% – Gotten base weight down/bought lighter gear
- 20.0% – Trained more/gotten in better shape
- 10.5% – Done more practice hikes
- 9.5% – Had gear more dialed in
- 5.0% – Planned less
- 5.0% – Started later
- 4.5% – Planned more
- 4.5% – Saved more money
- 4.5% – Started earlier
Thru-Hikers
28.5 lb
The average base weight of hikers who said they would have liked to have gotten lighter gear before starting their hikes (12.93 kg)
In addition to asking hikers what they would have done differently before their thru-hikes, I asked them what they wished they had done differently during their hikes.
During Hike Changes
- 33% – Swam more
- 18.0% – More pictures of people
- 18.0% – Started hiking earlier each day
- 17.5% – Slowed down
- 14.0% – Maintained a journal/blog
- 8.5% – Camped earlier each day
- 7.0% – More zero days
- 6.5% – More trail zeros
- 5.0% – Sped up
- 3.0% – Less time in town
- 2.5% – Fewer zero days
- 1.5% – Fished more
- 1.0% – More time in town
Thru-Hikers
76.7%
The average percentage of time JMT hikers packed out their toilet paper.
I ask hikers what advice they have for future JMT hikers. This will be thoroughly documented in the upcoming article JMT: Advice For The Future, but here is a sampling for now.
- Don’t quit on a bad day. There were some really bad days followed by great days, so stick with it. You never know what the next day will bring.
- Preparation is key before you go. Listen to your body. If you push yourself too hard today, you are borrowing from tomorrow. Go slower and enjoy the journey.
- Take rain gear! Don’t go with cheap equipment – I saw several groups with junk equipment (think Walmart or Big 5) that simply did not protect them in the hail storms.
- You never know what may happen on the trail. Know your exit points and have contact numbers for places like mule pack companies. You never know when you might need their services. I think a satellite device is invaluable. Seriously, consider bringing one.
Social Issues
The John Muir Trail is, for the most part, an amazing place filled with incredible people. However, just as the trail itself can be not so amazing at times – thunderstorms, fires, cows and their poops – the people too, can occasionally be trash.
Here are the social issues experienced by JMT hikers this year.

Ageism
Overall, 4.5% of hikers experienced ageism on the John Muir Trail from other hikers.
*As ageism was reported by hikers with a wide variety of ages, these percentages are for all hikers.
Homophobia/Transphobia
Overall, 7.1% of LGBTQIA+ hikers experienced homophobia or transphobia on the JMT from other hikers and people in town.
Racism
Overall, 2.5% of BIPOC hikers experienced racism on the JMT from people in town and 2.5% from other hikers.
Sexism
Overall, 11.7% of female hikers experienced sexism on the JMT. 10.5% experienced sexism from other hikers, 1.2% from people in town, and 1.2% from both their fellow hikers and people in town.
Animal Sightings
Lastly, we have some data that doesn’t fit anywhere else, so I tack it on at the end. What kind of wildlife did John Muir Trail hikers see in the Sierra Nevada?
The most common animals? Deer. The rarest of the animal kingdom? Skunks.
Animals Hikers Spotted
- 23.6% Black bear
- 3.2% Bobcat
- 18.4% Coyote
- 90.8% Deer
- 5.2% Fox
- 49.2% Grouse
- 89.2% Marmot
- 1.2% Mountain lion
- 4.8% Owl
- 65.2% Pika
- 6.8% Rattlesnake
- 0.8% Skunk
- 36.4% Snake

Support the Survey
Every year, I receive numerous requests for guidance on how to support the surveys. Beyond sharing them with your close-knit bubble of weird hiker friends, the best way to support the survey is to contribute via Patreon. You’ll get access to exclusive posts, discount codes, live streams, and super awesome stickers so that everyone will know how cool you are.
If you’re not into Patreon, that’s cool; you can Venmo @halfwayanywhere, Cash app $halfwayanywhere, or PayPal moc.erehwynayawflah@tcatnoc
This is not expected. The data collected in the survey will always be free and accessible to everyone who wants/needs it. Your support is much appreciated and helps pay the website (and survey) bills.


Finally, another HUGE THANK YOU to all the hikers who completed this year’s survey, including (but not limited to): 36, Ace, Bab, Banshee6, Bieber, Blister Girl, Booger-Man, Boujee, Camo Joe, Chaco, Chicken Legs, Chipmunk, Coconut, Coke Machine, Comet, Couscous Fantasy, Crazy Hiker, Crossing Queen, Data, Dawdles, Double Dip, E. T. (Elevated Turtle), Energizer Bunny, Froggy, Galileo, Gift, Good news, gooseberry, Gordy, Gourmet, Grasshopper, Greg, Hoover, Hubby calls me Goat, Hungry, Hurry, Jacou, Jourknee, Junk Wax, Kit Kat, Klopper, Knots, Marmot, Marmot, Mighty Mouse, Molasses!, Mongo, Monkey Bars, Mountain mama, NekkedDave, NyQuill, Obi-1, Old Goat, Ox, Pancakes, Pinochet, Pooh, Powerpuff, Rasdavid, Retro, RocketSprocket, Rockhead, Rumble, Shia lebouf, Shorts, Siesta, Sky Pilot, Smoke Stack, Smokey, Sprite, Steady, STINGER, Swim Team, Swiss Machine, TacoMa, Road Runner, Mtn Goat, Tater, Teddy, Tigger, Toque, Tortilla, Turtle, Waterfall, Weatherman, Well Seasoned Hiker, X, and Ziggy.
If you have any feedback, comments, suggestions to improve the survey, or data you would like to see in future posts or surveys, leave a comment below and let me know!
Affiliate Disclosure: This page may contain affiliate links, which means I may receive small commissions for purchases made via these links at no additional cost to you. This helps pay the bills and keep the site up and running. Thank you for your support!
Does anyone know from personal experience the temperature range along JMT during July? I have to choose between a 15 deg bag or 45 deg bag. Curious about the daily highs and lows.
Based on personal experience in the Sierra, I would say that if you’re asking this question, you should bring the 15-degree bag.