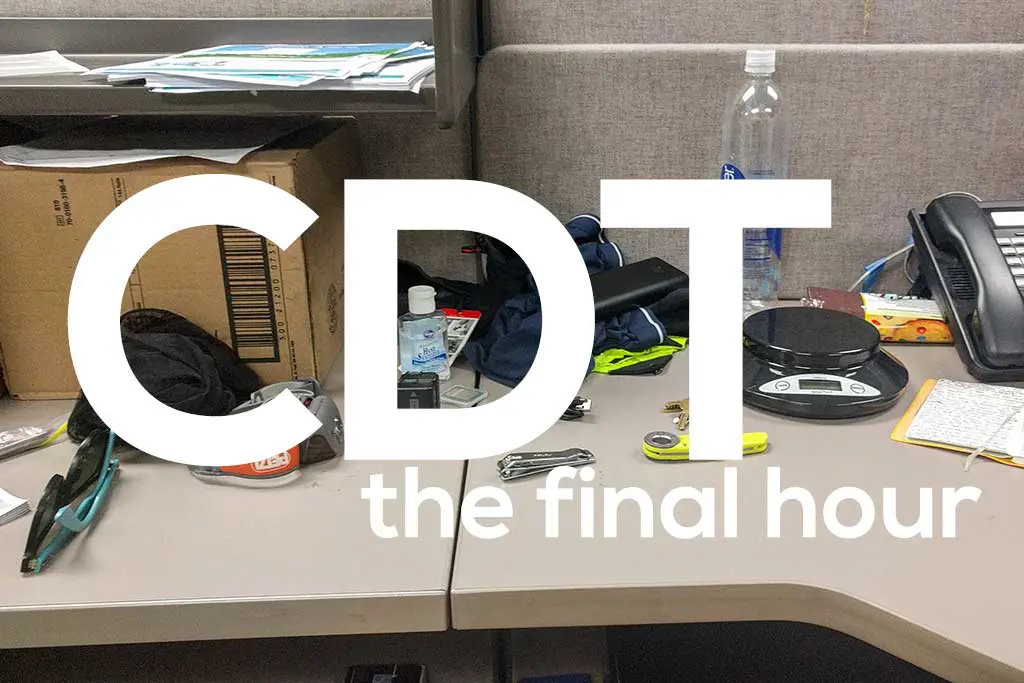
The Continental Divide Trail Thru-Hiker Survey (2018)
Hello and welcome to the results of the 2018 Continental Divide Trail Thru-hiker Survey!
This is now my second year doing this project and would like to extend a huge THANK YOU to everyone who took the time to participate. You’re amazing people. Also, thank you to everyone who was patient in waiting for the release of this year’s survey. I do everything on Halfway Anywhere by myself and these surveys take a LOT of time to put together.
I began this survey following my Continental Divide Trail thru-hike with the aim of turning it into a resource available to anyone hoping to hike the Continental Divide Trail. I am still looking to improve upon the data and its presentation and I would love to hear what you think via comment or email.
If this is your first visit to the CDT Thru-hiker Survey, be forewarned that the data should be looked at skeptically; there’s nothing scientific about this data or the way I gather it. Every year I get an email from someone criticizing my methods; I’m just some random guy on the internet trying to help future hikers – so take it easy, people. I do my best to distribute the survey as widely as possible and to accurately present the data collected from the year’s Continental Divide Trail class.
So now that you’ve read until a spot in the survey that most people have probably skipped, here are the results of Halfway Anywhere’s 2018 Continental Divide Trail Thru-hiker Survey:
JUMP TO A SECTION


NOTES ON THE DATA
- This year we had 103 completed surveys – up over 20% from last year.
- The responses to some questions have been sorted and colored in hopes of more usefully and accurately presenting the data (e.g. northbound vs. southbound).
- Not all CDT hikers document the stats of their thru-hike so the data is not guaranteed accurate (this is not science we’re dealing with).
- For simplicity, I refer to the survey respondents collectively as this year’s “class“. Remember this is only a fraction of this year’s CDT hikers and it is not necessarily representative of the entire CDT Class of 2018.
- If you find some small and meaningless discrepancy in the data, get over it. BUT – if you find large or obvious errors, please let me know.
- I will be releasing more detailed survey posts focused on CDT Gear, CDT Resupply, CDT Demographics, and CDT Advice in the coming weeks. If you would like to be notified of new surveys, click here.
Labels differentiating hiker segments:
- THRU: Thru-hikers (all)
- FINISH: Thru-hikers (all) who completed the entire CDT
- NOFINISH: Thru-hikers (all) who did NOT complete the CDT
- NOBO: Northbound thru-hikers (all)
- NOBO-0: Northbound thru-hikers who did NOT complete the CDT
- NOBO-1: Northbound thru-hikers who completed the CDT
- SOBO: Southbound thru-hikers (all)
- SOBO-0: Southbound thru-hikers who did NOT complete the CDT
- SOBO-1: Southbound thru-hikers who completed the CDT
If NO LABEL has been appended to a data point, then I used all data collected (this includes section hiker data).
SOUTHBOUND DATA: I received responses from TWELVE southbound thru-hikers (this includes two SOBO section hikers). Section hiker responses are not included in the SOBO-0 and SOBO-1 groups.
THE DEMOGRAPHICS
Our first section won’t help you prepare for a CDT thru-hike, but that doesn’t mean it isn’t interesting. Here are the HIKER DEMOGRAPHICS.
- CDT thru-hiker SEX
- 68% Male
- 32% Female
- CDT thru-hiker AGE
- 0% <20
- 8.8% 20-24
- 27.5% 25-29
- 19.6% 30-34
- 13.7% 35-39
- 9.8% 40-49
- 13.7% 50-59
- 6.9% 60-69
- 0% >70
- AVERAGE AGE | 37 (σ = 12)
- CDT thru-hiker RACE
- 71.8% Caucasian
- 1.9% 2+ Races
- 1% Asian
- 1% Hispanic
- 24.3% Declined to answer
- CDT thru-hiker EDUCATION level
- 2.9% <12th grade
- 10.7% High School Diploma
- 7.8% Some College
- 6.8% Associate Degree
- 43.7% Bachelor’s Degree
- 28.2% Graduate Degree
- COUNTRIES | Australia, Belgium, Canada, Czechia, France, Germany, Netherlands, New Zealand, Norway, Poland, Sweden, Switzerland, United Kingdom, USA (14 TOTAL)
- US STATES | AK, AZ, AR, CA, CO, FL, GA, IL, KY, LA, MA, MI, MN, MO, NH, NM, NY, NC, ND, OH, OR, PA, TN, TX, UT, VA, VT, WA, WI (29 TOTAL)
- TOP COUNTRIES
- USA 73.7%
- Australia 10.2%
- France 3%
- Germany 3%
- Switzerland 3%
- United Kingdom 3%
- Poland 2%
- TOP STATES
- Colorado 10.8%
- California 6.8%
- Pennsylvania 6.8%
- Virginia 6.8%
- Arizona 5.4%
- Massachusetts 5.4%
- Washington 5.4%
THE BASICS
Here we’ll take a look at DATES for thru-hikes, whether hikers were on their FIRST THRU-HIKE, what trails people ALREADY HIKED, whether hikers BEGAN ALONE, and what everyone thought about TRAIL EVENTS.
Of the thru-hikers this year, just 20% were on their first long-distance trail and 80% had already done a long-distance hike.
The trails most commonly hiked by those with experience were:
- 52% Pacific Crest Trail
- 47% Appalachian Trail
- 10% Colorado Trail
- 9% Te Araroa Trail
- 7% Camino de Santiago
- 6% Arizona Trail
- 6% Long Trail
- 5% John Muir Trail
- 3% Florida Trail
- 3% Tahoe Rim Trail
- 2% Continental Divide Trail
- 17% Other Long-distance Trail
- THRU – Did you begin ALONE?
- 59.8% Yes
- 20.6% No, began with friend(s)
- 17.6% No, I started with a partner (e.g. boy/girlfriend or spouse)
- 2% No, I arranged to start with other hikers (whom I had not met prior to beginning the CDT)
- THRU – What percentage of the time did you HIKE ALONE? | 56%
- THRU – What percentage of the time did you CAMP ALONE? | 41%
- THRU – IF YOU BEGAN/ENDED YOUR HIKE AT CRAZY COOK MENUMENT (NM) DID YOU TAKE THE CDTC SHUTTLE?
- 67% Yes
- 33% No
- NOBO– MONTH STARTED?
- 6.3% March
- 70% April
- 23.8% May
- NOBO – AVERAGE START DATE | April 22
- NOBO – AVERAGE DATE ENTERING SAN JUANS (LEAVE CHAMA, NM) | May 29
- NOBO– HAPPY WITH START DATE?
- 71.65% Yes
- 19.75% No, would start earlier
- 8.6% No, would start later
- NOBO– WHERE DID YOU BEGIN YOUR HIKE?
- 3% Columbus
- 97% Crazy Cook
- NOBO-1– WHERE DID YOU END YOUR HIKE?*
- 93% Chief Mountain*
- 7% Waterton
*NOTE: a wildfire forced the closure of access to Waterton at the end of August so many hikers ended up at Chief Mountain by default.
- NOBO– WHEN DID YOU CALL TO GET YOUR GLACIER PERMIT?
- 51.3% – Did not call ahead of time
- 25.6% – From East Glacier
- 5.1% – From Helena
- 3.8% – From Augusta
- 1.3% – From Lincoln
- NOBO-0 – AVERAGE START DATE | April 17
- NOBO-1 – AVERAGE START DATE | April 23
- NOBO-0 – AVERAGE DATE ENTERING SAN JUANS (LEAVE CHAMA, NM) | May 31
- NOBO-1 – AVERAGE DATE ENTERING SAN JUANS (LEAVE CHAMA, NM) | May 29
- NOBO-1 – AVERAGE END DATE | September 13
- NOBO-1 – AVERAGE COMPLETION TIME | 143 days (σ = 20.5)
The AVERAGE START DATE of NOBO THRU-HIKERS who said that they would have preferred to START EARLIER was May 4.
The AVERAGE START DATE of NOBO THRU-HIKERS who said that they would have preferred to START LATER was April 6.
- SOBO– MONTH STARTED?
- 30% June
- 70% July
- SOBO – AVERAGE START DATE | July 6
- SOBO– HAPPY WITH START DATE?
- 50% Yes
- 50% No, would start earlier
- 0% No, would start later
- SOBO– WHERE DID YOU BEGIN YOUR HIKE?
- 20% Waterton
- 80% Chief Mountain
- SOBO-1– WHERE DID YOU END YOUR HIKE?
- 11% Columbus
- 89% Crazy Cook
- SOBO-1 – AVERAGE START DATE | July 6
- SOBO-1 – AVERAGE END DATE | October 21
- SOBO-1 – AVERAGE COMPLETION TIME | 106 days (σ = 17.8)
- TRAIL DAYS ATTENDANCE
- 70.3% Did not attend
- 6.6% Would NOT attend again
- 23.1% Would attend again
Now let’s look at whether hikers TRAINED for the CDT. I had everyone RATE THEIR FITNESS on a scale of 0 (Overweight, lazy waste of life) to 10 (Godlike superhuman) with “Average Joe” in the middle at 5.
NOTE: These are PRE-TRAIL fitness levels.
- THRU – DID YOU TRAIN FOR THE CDT?
- 51% Yes
- 49% No
- THRU – AVERAGE FITNESS LEVEL | 6.3 (σ = 1.4)
- FINISH – AVERAGE FITNESS LEVEL | 6.3 (σ = 1.4)
- NOFINISH – AVERAGE FITNESS LEVEL | 6.3 (σ = 1.4)
THE HIKING
How much time did this year’s CDT class spend actually hiking?
Here we take a look at the HIKING STATS, including DAILY MILEAGE, number of ZEROES/NEAR-OS taken, and whether hikers FLIP-FLOPPED, hiked the ENTIRE CDT, or would hike the CDT AGAIN. This section also includes data on which ALTERNATES CDT hikers took. There are countless alternates along the CDT, but there are a few notable official and defacto official alternates for hikers to choose from.
- FINISH – AVERAGE DAYS ON TRAIL | 140 (σ = 22.6)
- FINISH – OVERALL AVERAGE DAILY MILEAGE* | 22.7 mi / 36.53 km (σ = 3.8 mi / 6.12 km)
- FINISH – AVERAGE ZERO DAYS | 15 (σ = 9.7)
- FINISH – AVERAGE DAYS HIKING (SUBTRACT ZERO DAYS) | 125.7 (σ = 19.4)
- FINISH – HIKING DAYS AVERAGE DAILY MILEAGE* | 25.2 mi / 40.56 km (σ = 4 mi / 6.44 km)
- NOBO-1 – PRE-SAN JUAN AVERAGE DAILY MILEAGE* | 22.21 mi / 35.74 km (σ = 5.76 mi / 9.27 km)
- NOBO-1 – POST-SAN JUAN MEADOWS AVERAGE DAILY MILEAGE* | 22.14 mi / 35.63 km (σ = 3.4 mi / 5.47 km)
- AVERAGE LONGEST DAY | 36.3 mi / 58.42 km (σ = 8.1 mi / 13.04 km)
- FINISH – AVERAGE NEAR-O DAYS | 14.8 (σ = 8.2)
*these values assume a 3,100 mi /4,989 km hike (I know, very few people actually hike this many miles – this should give you an upper boundary for your estimations)
- WOULD CONSIDER HIKING THE CDT AGAIN?
- 74% Yes
- 26% No
- THRU– DID YOU FLIP-FLOP?
- 18% Yes
- 82% No
- THRU– DID YOU HIKE A CONTINUOUS/UNBROKEN FOOTPATH OF THE CDT?
- 43.1% Yes, and I roadwalked around any fire closures.
- 11.8% Yes, but I skipped the fire closures.
- 14.7% Mostly, but I may have missed a few miles here or there.
- 15.7% No, I hitched past/skipped some small sections.
- 13.9% No, I hitched past/skipped large sections.
As much as we all like to think that we’re going to succeed, I guarantee you that not every aspiring thru-hiker beginning the CDT will make it to the end. Here’s what’s probably going to happen to you (if this year’s class is any indication).
- DID YOU COMPLETE THE CDT?
- 77% Yes
- 23% No
- WHY DID YOU NOT FINISH?
- 23.5% Snow
- 17.6% Injury
- 17.6% Personal
- 11.8% Financial
- 11.8% Fires
- 11.8% Illness
- 5.9% Family
- NOFINISH – AVERAGE MILES FINISHED | 1,718 mi / 2,765 km (σ = 653 mi / 1,051 km)
Now for the ALTERNATES! Many CDT hikers use an app appropriately titled “CDT” (aka “Guthook” aka “Atlas Guides”). This app shows the trail as well as many of the alternates, which are colored within the app to distinguish them from the official CDT. I’ve included the colors of each alternate below since many hikers simply use these colors to refer to/identify these other trails (e.g. “The brown alternate south of Grants”). If you’re interested in the app (and if you’re hiking the CDT, you should be), you can find it here: iOS/Android.
The colors used to identify the popularity of each alternate are as follows: OVER 66%, 33-66%, LESS THAN 33%
NEW MEXICO
- Columbus Alternate (Teal): 3%
- Gila River Alternate (Pink): 95%
- Gila River High Route Alternate (Orange): 15%
- Pie Town Alternate via Mangas Mountain (Blue): 64%
- Cebolla Wilderness Alternate (Brown): 54%
- Bonita-Zuni Alternate (Blue): 47%
- Mount Taylor Alternate (Purple): 71%
- Ghost Ranch Alternate (Green): 82%
- Other: 3%
COLORADO
- Great Divide Alternate (Green): 1%
- Elwood Pass (Blue): 8%
- Creede Cutoff (Brown): 19%
- Mirror Lake Alternate (Purple): 10%
- Silverthorne Alternate (Teal): 27%
- Montezuma Alternate: 1%
- Argentine Spine (Pink): 28%
- Rocky Mountain National Park Shortcut (Orange): 46%
- Other: 6%
WYOMING
- Ley Alternate south of Rawlins: 55%
- Lava Mountain Lodge: 2%
- Wind River High Route: 4%
- Cirque of the Towers (Blue): 81%
- Knapsack Col (Pink): 53%
- Leeds Creek (Teal): 17%
- Teton Alternate: 5%
- Other: 10%
IDAHO/MONTANA
- Mack’s Inn Alternate (Blue): 63%
- Big Sky Alternate: 10%
- Super Butte Cutoff: 3%
- Anaconda Cutoff (Blue): 55%
- Butte Connector (Brown): 10%
- Spotted Bear Pass (Orange): 33%
- Chief Mountain (Pink): 82%
- Other: 15%
“Ley Alternate” refers to an alternate route on the Ley Maps – maps produced by CDT hiker Jonathan Ley. More on the Ley Maps here.
THE RESUPPLY
For those of you thinking about setting off on a Continental Divide Trail adventure, you’re probably wondering about resupply (aka how and where do you get your hiker fuel aka food).
Here’s this year’s RESUPPLY STRATEGY, including the number of BOXES sent, and where hikers SUGGEST MAILING a box.
- RESUPPLY STRATEGY
- 5.9% mailed ALL boxes
- 81.2% mailed SOME boxes
- 12.9% mailed NO boxes
- FINISH – AVERAGE RESUPPLY STOPS MADE | 27 (σ = 3.9)
- FINISH – AVERAGE BOXES PREPARED PRE-TRAIL | 4.9 (σ = 6.2)
- FINISH – AVERAGE BOXES SENT | 7.9 (σ = 6)
REMEMBER that you can mail yourself boxes from ON THE TRAIL and don’t have to have ALL your resupply boxes prepared ahead of time. Many towns have large supermarkets. This year’s class sent themselves an average of 3 resupply boxes from on the trail (they prepared an average of 4.9 pre-trail but ended up sending themselves 7.9 total, on average).
What locations would hikers DEFINITELY MAIL a resupply box?
- Pie Town (New Mexico)
- Doc Campbell’s (New Mexico)
- Ghost Ranch (New Mexico)
- Benchmark Wilderness Ranch (Montana)
Brooks Lake Lodge (Wyoming)(Brooks Lake Lodge does not accept resupply packages)- Leadore/Bannock Pass (Idaho)
- Lima (Montana)
- South Pass City (Wyoming)
Where would hikers have preferred to MAIL A BOX instead of purchasing locally?
- Doc Campbell’s (New Mexico)
- Grand Lake (Colorado)
- Leadore/Bannock Pass (Idaho)
- Twin Lakes (Colorado)
- East Glacier Village (Montana)
- Lake City/Spring Creek Pass (Colorado)
- Pie Town (New Mexico)
- Creede (Colorado)
CHANGES to your resupply strategy?
- 27.8% – Send FEWER resupply boxes
- 19.4% – Send HEALTHIER FOOD in boxes
- 19.4% – Send MORE VARIETY in boxes
- 18.1% – Mail boxes from ON TRAIL instead of ahead of time
- 15.3% – Send MORE resupply boxes
- 13.9% – Send LESS FOOD in boxes
The average number of boxes sent by hikers who said they would liked to have sent FEWER boxes? 8.2. The average number of boxes sent by hikers who said they would liked to have sent MORE boxes? 6.2. The average number of resupply boxes sent? 7.9.
So if you’re taking this advice and looking to send SEVEN resupply boxes (which also fits with the strategy of only sending yourself SOME boxes), the places you should send them – according to this survey – are (from Mexico to Canada):
- Doc Campbell’s (New Mexico)
- Pie Town (New Mexico)
- Ghost Ranch (New Mexico)
- Twin Lakes (Colorado)
- Grand Lake (Colorado)
- Leadore/Bannock Pass (Idaho)
- Benchmark Wilderness Ranch (Montana)

I also asked hikers where they resupplied. I use the following colors to indicate the percentage of hikers who said they resupplied at each stop: OVER 66%, 33-66%, LESS THAN 33%.
- Lordsburg (99%)
- Columbus (1%)
- Deming (3%)
- Silver City (97%)
- Doc Campbell’s (97%)
- Reserve (14%)
- Pie Town (100%)
- Quemado (1%)
- Grants (99%)
- Cuba (96%)
- Santa Fe (6%)
- Ghost Ranch (85%)
- Taos (4%)
- Chama (Cumbres Pass) (97%)
COLORADO
- Pagosa Springs (Wolf Creek Pass) (85%)
- South Fork (Wolf Creek Pass) (14%)
- Platoro (1%)
- Del Norte (1%)
- Creede (28%)
- Silverton (Stony Pass) (21%)
- Durango (5%)
- Lake City (Spring Creek Pass) (72%)
- Monarch Mountain Lodge (Monarch Pass) (27%)
- Salida (Monarch Pass) (83%)
- Buena Vista (4%)
- Twin Lakes (81%)
- Leadville (53%)
- Copper Mountain (22%)
- Breckenridge (50%)
- Frisco (4%)
- Silverthorne (29%)
- Dillon (8%)
- Idaho Springs (3%)
- Winter Park (19%)
- Fraser (19%)
- Denver (18%)
- Grand Lake (97%)
- Steamboat Springs (Rabbit Ears Pass) (95%)
- Encampment (Battle Pass) (59%)
- Riverside (Battle Pass) (24%)
- Rawlins (100%)
- South Pass City (54%)
- Atlantic City (23%)
- Lander (56%)
- Pinedale (53%)
- Lava Mountain Lodge (Togwotee Pass) (4%)
- Dubois (Togwotee Pass) (76%)
- Jackson (Togwotee Pass) (15%)
- Brooks Lake Lodge (18%)
- Grant Village (Yellowstone) (38%)
- Old Faithful Village (Yellowstone) (88%)
IDAHO/SOUTHERN MONTANA
- West Yellowstone (27%)
- Island Park (Mack’s Inn) (53%)
- Lima (81%)
- Leadore (Bannock Pass) (77%)
- Tendoy (3%)
- Salmon (26%)
- Jackson (6%)
- Darby (Lost Trail Pass) (53%)
- Hamilton (Lost Trail Pass) (4%)
- Wisdom (6%)
NORTHERN MONTANA
- Wise River (8%)
- Anaconda (62%)
- Butte (44%)
- Helena (81%)
- Elliston (6%)
- Lincoln (86%)
- Benchmark Wilderness Ranch (28%)
- Augusta (49%)
- East Glacier Village (100%)
- Two Medicine (55%)
- St Mary (5%)
- Many Glacier (65%)
But what about actually getting to town? Sometimes the trail crossed a road quite far from a resupply point and instead of walking into town, hikers typically elect to hitchhike. So what about hitchhiking? Here are the resupply stops hikers had difficulty making it to from the trail (i.e. they had to wait a long time to get a ride). The top responses were:
- Lander (Wyoming)
- Augusta (Montana)
- Encampment via Battle Pass (Wyoming)
- Lake City via Spring Creek Pass (Colorado)
- Leadore via Bannock Pass (Idaho)
- Chama via Cumbres Pass (New Mexico/Colorado)
But let’s forget about hitchhiking because that’s a completely subjective thing that could easily swing in your favor if you happen to rock up to the road at the right time. What you really need help figuring out is where the cool places to head to on trail are. Here are hikers’ FAVORITE and LEAST FAVORITE resupply points.
FAVORITE RESUPPLY POINTS
- NEW MEXICO: Pie Town
- COLORADO: Salida (Monarch Pass)
- WYOMING: Pinedale
- MONTANA: Helena
HONORABLE MENTIONS
- Leadville (Colorado)
- Darby (Montana)
LEAST FAVORITE RESUPPLY POINTS
- Grants (New Mexico)
- Benchmark Wilderness Ranch (Montana)
- Cuba (New Mexico)
- Ghost Ranch (New Mexico)
- Rawlins (Wyoming)
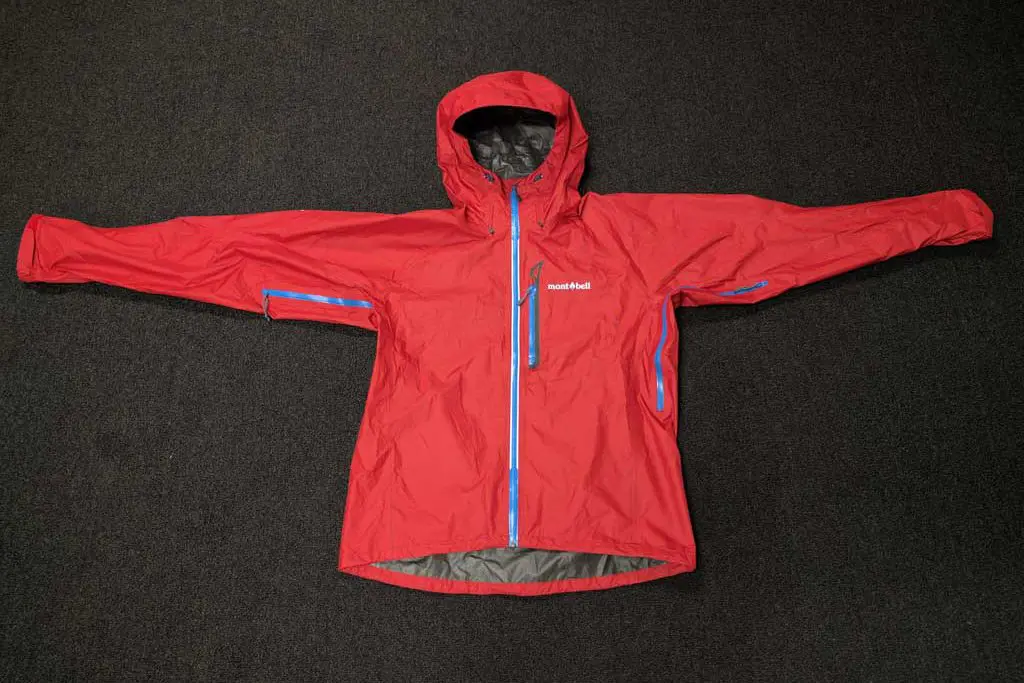
THE GEAR
If there’s anything that can compete with resupply for “most time spent thinking about before a thru-hike”, it’s gear. Getting gear together for a thru-hike can be a challenge, especially if you’re in the majority of hikers who haven’t attempted a long-distance trail before.
Now we investigate the CDT Class of 2018’s gear.
- THRU – AVERAGE BASE WEIGHT (START) | 14.8 lb / 6.71 kg (σ = 5.3 lb / 2.4 kg)
- THRU – AVERAGE BASE WEIGHT (END) | 14.7 lb / 6.67 kg (σ = 4.8 lb / 2.18 kg)
- THRU – AVERAGE AMOUNT SPENT ON GEAR | $1,015 (σ = $873)
- FINISH – PAIRS OF SHOES USED (AVERAGE) | 4.2 (σ = 1)
- FINISH – AVERAGE AMOUNT SPENT ON ENTIRE HIKE | $5,532 (σ = $2,288)
- AVERAGE SLEEPING BAG TEMPERATURE RATING | 16.4°F / -8.67°C
- AVERAGE BACKPACK SIZE | 53.5 L
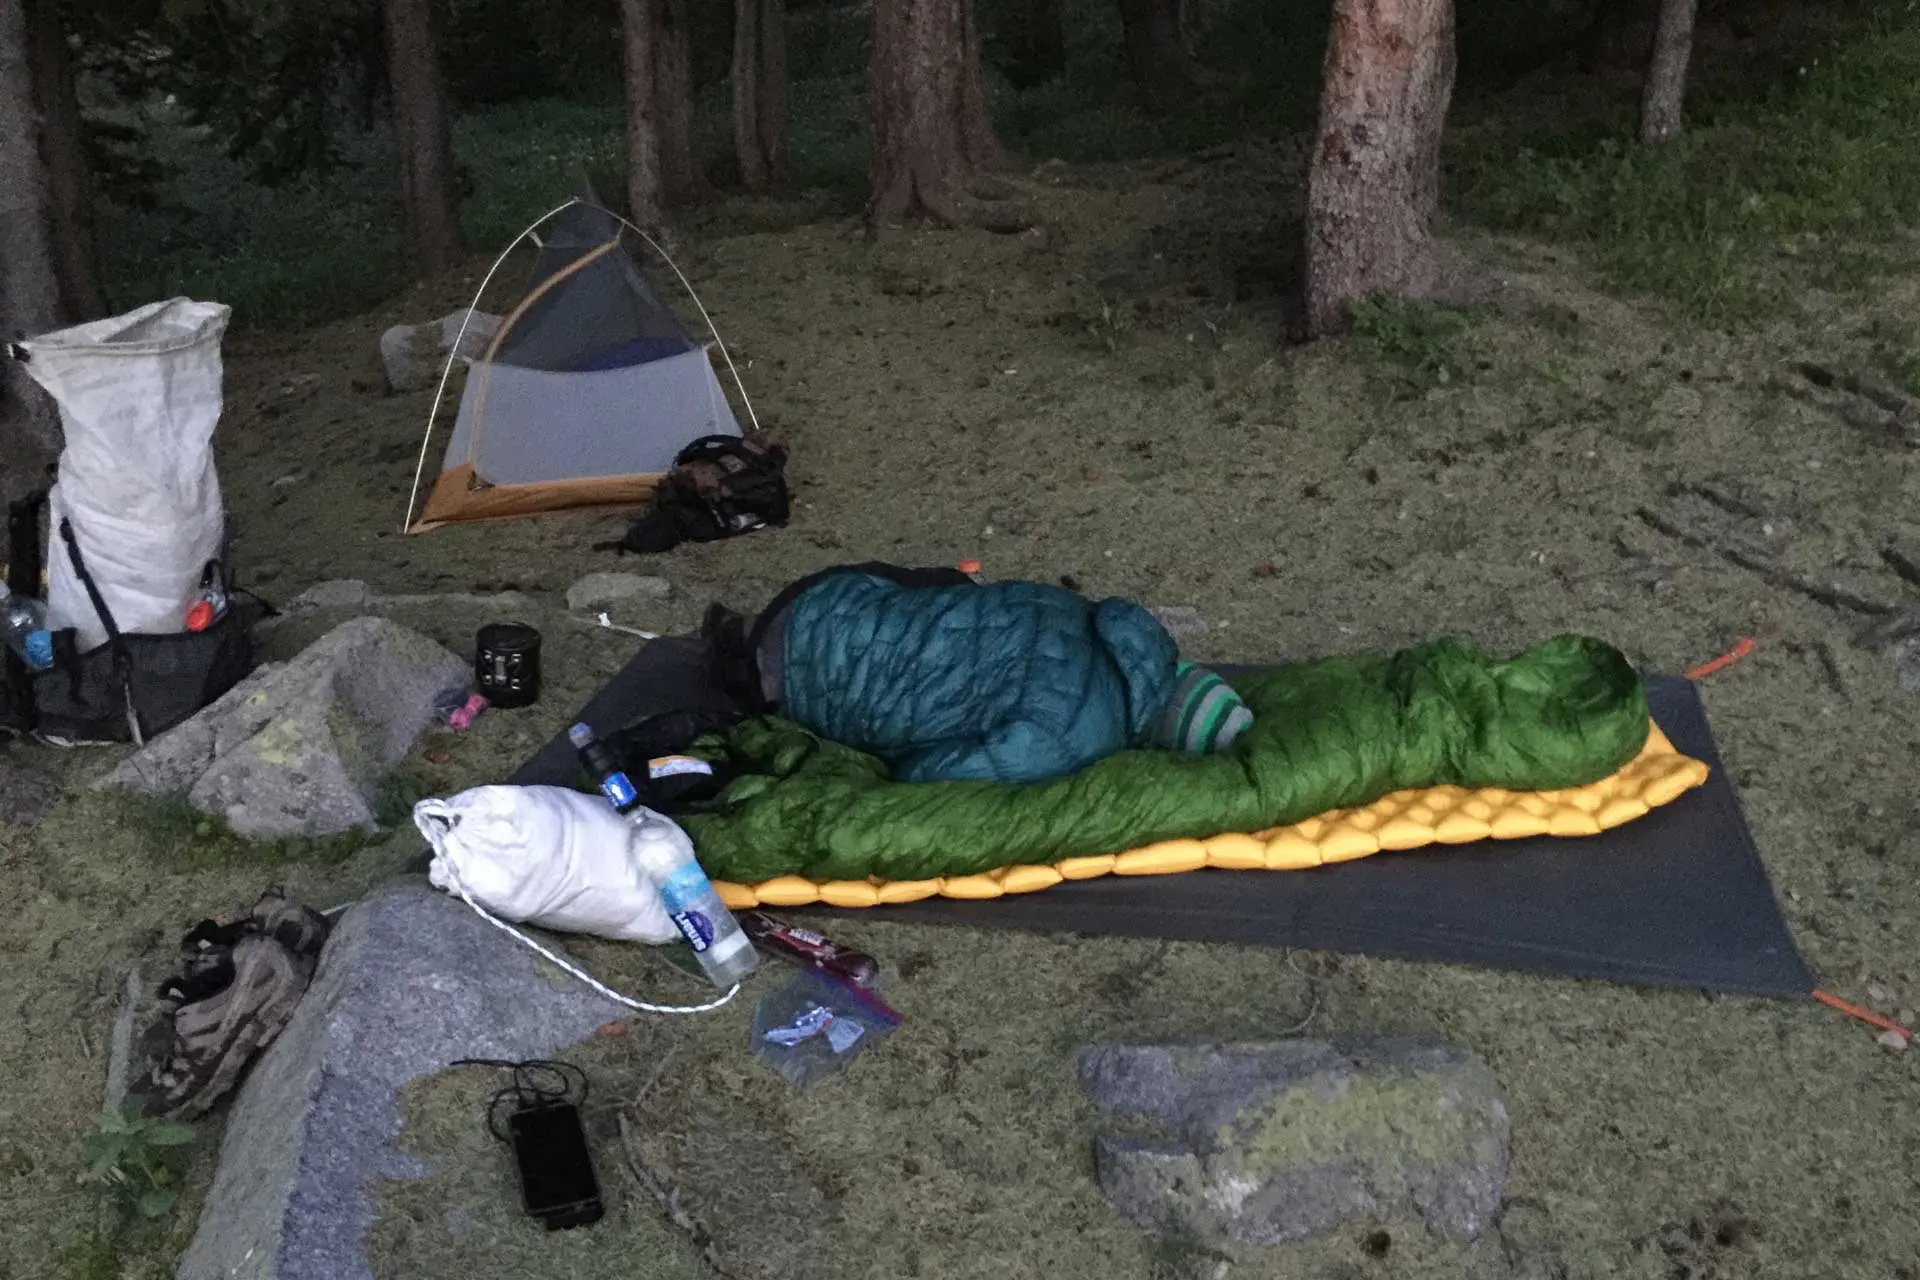
Here are the FAVORITE “Big 4” items: PACKS, SHELTERS, SLEEPING BAGS, and SLEEPING PADS (I know it’s the “Big 3”, but I include sleeping pads). This year, I’ve changed the SATISFACTION RATING for each piece of gear from a “LIKE/DISLIKE” answer to a numerical rating.
NOTE: If two items were tied for a rating, the tie goes to the piece of gear that more people were using.

- ULA Catalyst (Hiker Rating: 4.8/5)
- ULA OHM 2.0 (4.8/5)
- Hyperlite Mountain Gear Southwest / Windrider (4.38/5)
- ULA Circuit (4.2/5)
- Osprey Exos (4.17/5)
- Tarptent Notch (Hiker Rating: 5/5)
- Big Agnes Copper Spur HV UL1 (4.8/5)
- Zpacks Hexamid (4.72/5)
- Big Agnes Copper Spur HV UL2 (4.33/5)
- Zpacks Duplex (4.29/5)

- Western Mountaineering Versalite (Hiker Rating: 5/5)
- Western Mountaineering UltraLite (5/5)
- Feathered Friends Lark UL (5/5)
- REI Igneo (4.41/5)
- Enlightened Equipment Enigma (4.4/5)

- Sea to Summit UltraLight Insulated (Hiker Rating: 5/5)
- Therm-a-Rest NeoAir XTherm (4.88/5)
- Therm-a-Rest Z Lite Sol (Short) (4.6/5)
- Therm-a-Rest NeoAir XLite (4.56/5)
- Therm-a-Rest NeoAir XLite (Short) (4.43/5)
In addition to the pieces of gear designed to break the bank and keep you alive, thru-hikers need to consider what they’re bringing in the STOVE, WATER TREATMENT, and SHOE departments. Here’s the MOST COMMON gear:

- MSR PocketRocket 2 (Hiker Rating: 4.75/5)
- Snow Peak LiteMax (4.4/5)
- Jetboil MiniMo*
- JetBoil Zip*

- Sawyer Squeeze (Hiker Rating: 4.02/5)
- Bleach (4.54/5)
- Aquamira (4.55/5)
- Sawyer MINI (3.67/5)

- Altra (Hiker Rating: 4.34/5)
- Salomon (4.78/5)
- La Sportiva (4.83/5)
- Brooks (4.5/5)
- Merrell (4.3/5)

- Altra Lone Peak 3.5* (Hiker Rating: 4.21/5)
- Salomon XA Pro 3D (4.83/5)
- Altra Lone Peak 3.0* (4.4/5)
- Brooks Cascadia 12** (4.4/5)
- Altra Timp (4.33/5)
*The Altra Lone Peak 3.0 and 3.5 have been discontinued and have been replaced by the Altra Lone Peak 4.0.
**The Brooks Cascadia 12 have been discontinued and replaced with the Brooks Cascadia 13.
And if you can’t wait for more comments on gear, here is some wisdom from the CDT Class of 2018:
- Don’t make yourself miserable being ultralight. Ultralight is supposed to make the hike nicer, not extremely uncomfortable.
- Down pants are the shit.
- Looking at Altra footprints all day is boring.
- It gets cold on the CDT at night. If you want to sleep well, be prepared.
- AT&T was pretty worthless. Verizon had much better coverage everywhere.
- Carry a PLB or SPOT – they’re expensive, but I’m sure someone who loves you would help pay for one. There were probably a half dozen times someone said to me, “I don’t have a SPOT, so if you don’t see me for a while after this sketchy section…”
And while we’re talking about the things CDT hikers are carrying, let’s look at what hikers were using in as far as MAPS and APPS. This year, I also asked hikers the TYPE OF PHONE they used on the trail (although I don’t see exactly how this would be useful). The responses were:
- WHAT PHONE DID YOU USE?
- 45.5% iOS (iPhone)
- 53.5% Android
- 1% “I don’t have a phone”
THE HEALTH
The question of water treatment and hygiene is a big consideration for hikers (however, it’s typically something you worry less about as the trail goes on).
Here are the stats on hiker HEALTH and WATER TREATMENT.
- DID YOU FILTER WATER?
- 37.2% Always
- 36.3% Mostly
- 25.5% Sometimes
- 1% Never
- DID YOU GET SICK?
- 12.8% Yes
- 87.2% No
Now we can get to the fun part and take a detailed look at who made wise choices with their water sources on CDT. Obviously, everyone wants to look cool in front of their friends by not filtering water, but there are risks to the badass thru-hiker lifestyle.
How often did you treat water sources and did you get sick (3+ days of digestive issues, or a diagnosed giardia)?
- 2% Always treated, got sick
- 35.3% Always treated, never got sick
- 5.9% Mostly treated, got sick
- 30.4% Mostly treated, never got sick
- 4.9% Sometimes treated, got sick
- 20.6% Sometimes treated, never got sick
- 0% Never treated, got sick
- 1% Never treated, never got sick
In total, a reported 12.8% of hikers came down with something akin to giardia, and just 1% never filtered (those who don’t filter are typically quite staunch in their commitment to their strategy; read: don’t readily admit to becoming sick from not filtering).
THE LIKES AND DISLIKES
You may not be aware, but the Continental Divide Trail is a long hike with a lot to see (mostly bears). Here’s a look at the sections of trail that CDT thru-hikers LIKED and DISLIKED.
- Wind River Range (Wyoming)
- Glacier National Park (Montana)
- San Juan Mountains (Colorado)
- Gila National Forest (New Mexico)
- Idaho/Montana Border
- Pie Town to Grants (New Mexico)
- Southern New Mexico
- Great Divide Basin (Wyoming)


I asked hikers what CDT RESOURCES they found most and least valuable when planning their hikes.
- Halfway Anywhere* :)
- Hiker Blogs
- YouTube
- Friends/Former thru-hikers
- CDT Facebook Pages/Groups
- CDTC Website
- Yogi’s CDT Guide
*It’s awesome that after the first year of this survey it’s already helping out CDT hikers. THANK YOU, everyone who supports the site and encourages me to keep doing what I’m doing!
THE FEAR, REGRETS, AND ADVICE
When asked if hikers ever felt LEGITIMATELY AFRAID on the trail, this is what they had to report (more of this will be included in a future post, but for now, here are some that stood out):
- Around Lordsburg I saw some shady people.
- Getting a hitch with some dudes who were definitely a little drunk.
- Hiking on exposed ridgelines during a thunderstorm.
- Yes. Sheep dogs chased after us, and the fucking cowboy (sheepboy?) just sat on his horse and laughed at us for a few minutes before calling them off. What a jerk.
- I went off the trail to go around some snow and ended up climbing some very loose rock for about 100 feet with a big fall behind me. That was scary.
- Dogs on the outskirts of towns or near in the wilderness.
- In the Winds after being in the immediate vicinity of a deadly grizzly attack….we were stopped by search and rescue looking for the victim.
Now for CDT Class of 2018 wisdom: what would you have DONE DIFFERENTLY if you were to do it all over again?
- I should have hiked a lot more miles prior to the start of my hike.
- Flown to Arizona instead of Houston so the train to Lordsburg was shorter.
- Wish I had started in shoes not boots and had Guthook on my phone as well as partner’s for double-checking information and as back-up.
- I wish I had kept a journal.
- I would have tried to hit towns more on weekdays.
I also asked this class what ADVICE FOR FUTURE CDT HIKERS they had. Here are some of my favorites:
- Don’t listen to other people trying to tell you how to hike your hike. Bring bear spray in Montana and Northern Wyoming. Do your research beforehand and know what you’re getting into. Check the weather when in town.
- Conquer any fears you may have of cows. Embrace the Mootality!
- Make sure you like road walking before deciding to thru-hike the CDT!
- There is no purism on the CDT. Keep your eye out for cool alternates, there’s a lot. Fuck paved road walks, don’t kill your feet to add/save some miles.
- You walk one step at a time, no matter who you are and how fast you do it, you can still only go one step at a time. Know in yourself that all you have to do at any given time is have the willpower to take one more step. Also, no matter how bad the water looks, collect some anyway.
- Do it. But be prepared and confident that you can do it alone. This is not the social club that the AT has become.
- Buy an umbrella because there’s like three trees and they’re on fire.
There is a lot of information in these responses, so I will be making a separate post with ALL (some) of the responses. After all, one of the top resources reported by this year’s class was “former thru-hikers” and now that’s exactly what they all are.
THE CHANGES FROM LAST YEAR
- ADDED QUESTION: Did you use a freestanding tent?
- ADDED QUESTION: Which model of shoe did you use?
- ADDED QUESTION: What is your job when you’re not hiking?
- ADDED QUESTION: What kind of phone did you use on the trail?
- ADDED QUESTION: What app(s) did you use on trail?
THE CHANGES FOR NEXT YEAR
Here are the changes that I’ve decided on for next year’s survey. If you have any suggestions, I would love to hear them – leave a comment below to let me know.
- ADD QUESTION: Did you use trekking poles?
- ADD QUESTION: Which brand of trekking poles did you use?
- ADD QUESTION: Which model of trekking poles did you use?
CDT Survey Collection
Finally, another BIG THANKS to and all the other hikers who completed this year’s survey, including (but not limited to): 7 O’Clock, Beaver, BeeDub, Blast, Blaze, Bonefish, Boretide, Bourbon, Bud, Bueller, Canadian Style, Cattywampus, Chippy, Chopsticks, Clean Sweep, Clouds, Columbus, Country Mouse, Cucumber, Da Bear, Dang Daniel, Deepwater, Delayed Gratification, Deuces, Downtime, Draggin’ Tail, Dreamwalker, Duffle Miner, England, Famous, Fenway, Flash, Flyby, Goldilocks, Grasshopper, Hodge Podge, Honeybuns, Hopeful, Humen, Hummingbird, Iceman, Jean Valjean, Jennifer, Knots, Kodachrome, MacGyver, Medic, Mould, Nemo, NoDay, Nuwanda, Optimist, Orange, Peewee Kiwi, Peppermint Skunk, Pinata, Pony Whisperer, Quetzal, Ranger, Ripple, Robin, Rookie, Sandy Cheeks, Sequoia, Slide Sule, Slobber, Slow, Smoky, Snake Farm, Sockeye, Sonic, Sour Straws, Speedy, Steady, Taz, Teddy Bear, Terminator, Tex-mart, The Gimp, The Girl, Thumper, Top Nach, Twisted, Wiggles, Yoda, Zebra, and Zed.
In the next couple of weeks, I will be evaluating and posting more from this year’s survey, including gear breakdowns, resupply strategies, demographics, and more.
I spent a lot of hours putting this together and would love your feedback. Please COMMENT BELOW or get in touch to tell me what you think!
Affiliate Disclosure: This page may contain affiliate links, which means I may receive small commissions for purchases made via these links at no additional cost to you. This helps pay the bills and keep the site up and running. Thank you for your support!
Was your packages sent general del.
I am assuming this is meant to say, “Were your packages sent ‘general delivery’ to post offices?”
Yes.
Yes thanks
To me, parsing it like this makes much more sense/use:
Of those who Always treated:
5% Always treated, got sick
95% Always treated, never got sick
Of those who Mostly treated:
16% Mostly treated, got sick
84% Mostly treated, never got sick
Of those who Sometimes treated:
19% Sometimes treated, got sick
81% Sometimes treated, never got sick
Otherwise this was great!
Thanks for the suggestion! I’ll most likely break it down this way for this year’s survey :)
This has been incredibly helpful! If I were going to add questions I’d like to know what gear women used, especially sleeping bags, packs, and shoes that have female-specific sizes. I’d also like to know how people are charging their phones.
I did a breakdown of women-specific gear in the CDT Gear Guide here: https://www.halfwayanywhere.com/trails/continental-divide-trail/cdt-gear-guide-2018/
Great job as usual Mac.
Thanks for doing these! Are you gonna keep posting your CDT journals?
I am indeed, just figure that these surveys are more time-sensitive for people wanting to do their research before getting on the trail.
You should win a Pulitzer for these surveys.
Put me on the list!
Yet another thoroughly helpful and enjoyable read. I’m just going to sit here and await the next one. Thanks Mac!
You’ll have to wait until Monday :)