Pacific Crest Trail Hiker Comparison (Class of 2019)
In preparation for what’s going to be a very odd year of hiker surveys (the 2020 surveys for anyone reading this sometime in the future – if the world has managed to survive), I’ve decided to finish the final member (for now) of the Pacific Crest Trail Survey Family from last year’s PCT Class – the hiker breakdown. This is basically where we compare different groups of hikers on the trail – first-time vs. experienced thru-hikers, older vs. younger hikers, northbound vs. southbound hikers, etc.
If you find yourself reading and wondering, “It would be interesting to see how X compares to Y,” let me know in a comment (or via message) and I might add it here (or to next year’s survey).
Notes on the data
- There were a total of 846 completed surveys.
- Some responses have been sorted and colored to represent different hiker segments.
- Not all PCT hikers meticulously document their thru-hike (I’m weird). Therefore, the data is not going to be 100% accurate. That said, it should be fairly close to the reality of the trail.
- I refer to survey respondents collectively as the year’s “class“. Remember, this is a sample and not a comprehensive survey of every single PCT hiker on the trail.
- For stats requiring the length of the PCT for a calculation, I use 2,660 mi / 4,280 km.
- If some of the “Overall Stats” differ from category to category it’s because none of the survey questions are mandatory. Therefore, the group of hikers included in the responses for “Fast vs. Slow Hikes” may differ from that of “Cheap vs. Expensive Hikes”.
Labels differentiating hiker segments:
- THRU: Thru-hikers (all)
- THRU-1: Thru-hikers who completed the entire PCT
If NO LABEL has been appended to a data point, I used all data collected.
Male vs. Female Hikers
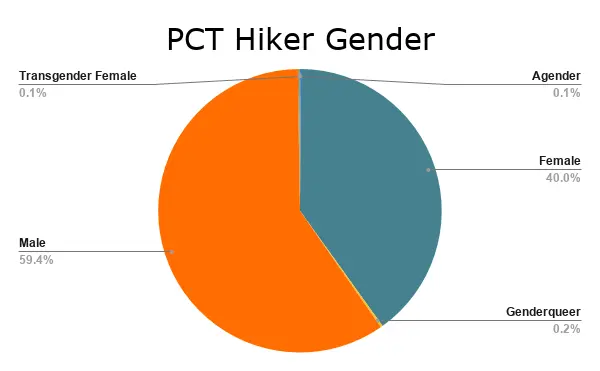
First up, let’s look at the difference between sexes on the Pacific Crest Trail. The overall breakdown of hiker gender was as follows:
- 59.4% Male
- 40% Female
- 0.2% Genderqueer*
- 0.1% Transgender Female*
- 0.1% Agender*
*I did not include these categories in the chart below because the data would be reflective of only a single person’s (or couple people’s) hikes. Also, note that categories are self-selected by survey respondents.
| Female | Male | Overall | |
|---|---|---|---|
| Completion percentage | 51.19% | 60.72% | 57.10% |
| Age (mean/median) | 33/29 | 37/31 | 35/30 |
| THRU-1: Days on trail | 156.25 | 132.39 | 152.19 |
| Pre-trail fitness level | 5.97 | 6.45 | 6.26 |
| THRU-1: Longest day | 38.75 mi / 62.36 km | 41.87 mi / 67.38 km | 40.80 mi / 65.66 km |
| THRU-1: Zero days | 18.99 | 17.87 | 18.2 |
| THRU-1: Nearo days | 17.09 | 13.92 | 15.09 |
| THRU-1: Resupply stops | 27.75 | 27.54 | 27.63 |
| THRU-1: Resupply boxes | 8.38 | 7.88 | 8.09 |
| Base weight (start) | 17.75 lb / 8.05 kg | 17.89 lb / 8.12 kg | 17.78 lb / 8.06 kg |
| THRU-1: Base weight (end) | 14.55 lb / 6.6 kg | 15.16 lb / 6.876 kg | 14.91 lb / 6.763 kg |
| Amount spent on gear | $1,420 | $1,515 | $1,477 |
| THRU-1: Total amount spent | $6,466 | $6,633 | $6,561 |
| Pack size | 54.12 L | 55.28 L | 54.89 L |
| Sleeping bag rating | 14.56°F / -9.69°C | 18.59°F / -7.45°C | 16.9°F / -8.38°C |
| THRU-1: Pairs of shoes used | 4.55 | 4.68 | 4.65 |
Hiker Age Breakdown
Next, hikers are broken down by age. The average age of this year’s class was thirty-five 35 (σ = 13). That said, the median age was 30. If you don’t know the significance of σ or median, I suggest you consult Google.
Here’s how many hikers fall into each age range:
- 46.46% – Under 30
- 28.33% – 30 to 39
- 7.56% – 40 to 49
- 9.36% – 50 to 59
- 8.28% – 60 or older
Noteworthy data here? The completion percentage dropped with age.

| < 30 | 30-39 | 40-49 | 50-59 | 60+ | Overall | |
|---|---|---|---|---|---|---|
| Completion percentage | 62.18% | 58.12% | 43.55% | 23.38% | 13.04% | 57.10% |
| THRU-1: Days on trail | 150.55 | 153.8 | 151.81 | 154.63 | 170 | 152.19 |
| Pre-trail fitness level | 6.32 | 6.17 | 6.08 | 6.47 | 6.68 | 6.26 |
| Pre-trail experience | 5.16 | 6.06 | 6.59 | 6.26 | 7.14 | 5.61 |
| THRU-1: Longest day | 42.35 mi / 68.16 km | 39.75 mi / 63.97 km | 39.31 mi / 63.26 km | 34.69 mi / 55.83 km | 31.78 mi / 51.14 km | 40.80 mi / 65.66 km |
| THRU-1: Zero days | 18.31 | 18.97 | 15.35 | 14.73 | 19.67 | 18.2 |
| THRU-1: Nearo days | 15.32 | 15.41 | 15.08 | 12.64 | 8.75 | 15.09 |
| THRU-1: Resupply stops | 27.50 | 28.43 | 25.50 | 28.10 | 26.57 | 27.63 |
| THRU-1: Resupply boxes | 7.90 | 8.25 | 7.35 | 10.25 | 9.22 | 8.09 |
| Base weight (start) | 17.75 lb / 8.05 kg | 18.03 lb / 8.178 kg | 19.41 lb / 8.804 kg | 18.49 lb / 8.387 kg | 20.8 lb / 9.435 kg | 17.78 lb / 8.06 kg |
| THRU-1: Base weight (end) | 14.40 lb / 6.531 kg | 15.62 lb / 7.085 kg | 15.33 lb / 6.953 kg | 14.38 lb / 6.523 kg | 18.22 lb / 8.264 kg | 14.91 lb / 6.763 kg |
| Amount spent on gear | $1,493 | $1,581 | $1,471 | $1,612 | $1,535 | $1,477 |
| THRU-1: Total amount spent | $6,537 | $6,478 | $7,105 | $6,836 | $7,100 | $6,561 |
| Pack size | 53.45 L | 55.43 L | 56 L | 58.91 L | 57.75 L | 54.89 L |
| Sleeping bag rating | 16.98°F / -8.34°C | 17.4°F / -8.11°C | 18.62°F / -7.43°C | 15.57°F / -9.13°C | 17.9°F / -7.83°C | 16.9°F / -8.38°C |
| THRU-1: Pairs of shoes used | 4.57 | 4.7 | 4.85 | 5.13 | 4.67 | 4.65 |
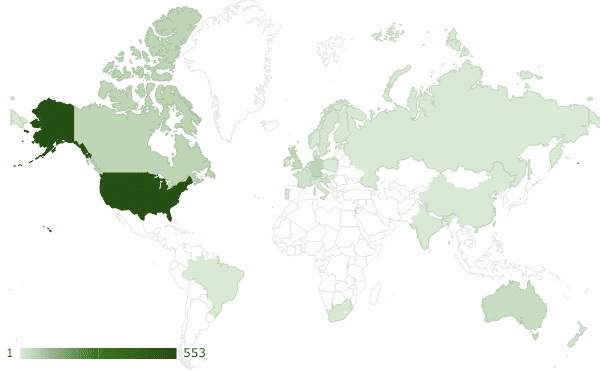
Domestic vs. International Hikers
This year’s class had hikers from 32 countries: Australia, Austria, Belgium, Brazil, Brunei, Canada, China, Croatia, Czechia, Denmark, Estonia, Finland, France, Germany, Hungary, India, Ireland, Israel, Italy, Netherlands, New Zealand, Norway, Poland, Portugal, Russia, Slovenia, South Africa, Sweden, Switzerland, Taiwan, United Kingdom, and the United States.
Domestically, there were hikers from Puerto Rico and 46 states – all except Arkansas, Delaware, Rhode Island, and West Virginia.
Despite domestic hikers reporting being more experienced and in better shape than international hikers, the international hiking contingent had an almost 7% higher completion percentage than domestic hikers. Maybe the option to (more) easily go home is a bit of a liability?

| Domestic | International | Overall | |
|---|---|---|---|
| Completion percentage | 54.70% | 61.63% | 57.10% |
| THRU-1: Days on trail | 151.4 | 153.57 | 152.19 |
| Pre-trail fitness level | 6.36 | 6.11 | 6.26 |
| Pre-trail experience | 5.64 | 5.6 | 5.61 |
| THRU-1: Longest day | 41.84 mi / 67.33 km | 39.23 mi / 63.13 km | 40.80 mi / 65.66 km |
| THRU-1: Zero days | 18.06 | 18.53 | 18.2 |
| THRU-1: Nearo days | 14.96 | 15.49 | 15.09 |
| THRU-1: Resupply stops | 27.46 | 27.89 | 27.63 |
| THRU-1: Resupply boxes | 8.78 | 7.02 | 8.09 |
| Base weight (start) | 17.46 lb / 7.92 kg | 18.46 lb / 8.373 kg | 17.78 lb / 8.06 kg |
| THRU-1: Base weight (end) | 14.43 lb / 6.545 kg | 15.7 lb / 7.121 kg | 14.91 lb / 6.763 kg |
| Amount spent on gear | $1,511 | $1,628 | $1,477 |
| THRU-1: Total amount spent | $6,637 | $6,517 | $6,561 |
| Pack size | 54.66 L | 55.37 L | 54.89 L |
| Sleeping bag rating | 16.58°F / -8.57°C | 17.58°F / -8.01°C | 16.9°F / -8.38°C |
| THRU-1: Pairs of shoes used | 4.76 | 4.47 | 4.65 |
Rookie vs. Experienced Thru-hikers
Surely more-experienced thru-hiker stood a better chance of completing the trial than rookie thru-hikers, right? Right. More-experienced hikers not only had a higher PCT completion percentage, but they also completed the trail faster – despite taking more zero days (on average).
Of this year’s class:
- 68% were on their first thru-hike
- 32% had previous thru-hiking experience
- On a scale of 1 to 10, 5.6 was the average PCT hiker’s reported experience (σ = 2.96)
- The Appalachian Trail was the most-common trail hiked by thru-hikers with long-distance hiking experience – just over 10%.

| Rookie | Experienced | Overall | |
|---|---|---|---|
| Completion percentage | 55.41% | 61.86% | 57.10% |
| THRU-1: Days on trail | 153.08 | 150.47 | 152.19 |
| Pre-trail fitness level | 6.15 | 6.53 | 6.26 |
| Pre-trail experience | 4.56 | 8.49 | 5.61 |
| THRU-1: Longest day | 40.33 mi / 64.9 km | 41.79 mi / 67.25 km | 40.80 mi / 65.66 km |
| THRU-1: Zero days | 17.99 | 18.72 | 18.2 |
| THRU-1: Nearo days | 15.4 | 14.44 | 15.09 |
| THRU-1: Resupply stops | 27.64 | 27.66 | 27.63 |
| THRU-1: Resupply boxes | 8.37 | 7.50 | 8.09 |
| Base weight (start) | 18.4 lb / 8.346 kg | 16.40 lb / 7.439 kg | 17.78 lb / 8.06 kg |
| THRU-1: Base weight (end) | 15.19 lb / 6.89 kg | 14.35 lb / 6.509 kg | 14.91 lb / 6.763 kg |
| Amount spent on gear | $1,5978 | $1,450 | $1,477 |
| THRU-1: Total amount spent | $6,786 | $6,086 | $6,561 |
| Pack size | 55.56 L | 53.43 L | 54.89 L |
| Sleeping bag rating | 16.5°F / -8.16°C | 17.92°F / -7.82°C | 16.9°F / -8.38°C |
| THRU-1: Pairs of shoes used | 4.66 | 4.64 | 4.65 |
Fast vs. Slow Thru-hikers
Now we’re moving into the realm of comparing hikers who completed the entire PCT. First up? Faster-than-average and slower-than-average hikes. The average amount of time it took hikers to complete the PCT was 152.19 days – basically five months.
The hikers who completed the PCT faster reported being more experienced and more fit before starting their hikes – and reported lower base weights. Makes sense, I guess. Faster hikers also took nearly 10 fewer zero days overall than slower hikers.
Note: The data below is entirely from thru-hikers who completed the entire trail as it wouldn’t make sense to include anyone else.

| Hikes < 152 Days | Hikes > 152 Days | Overall | |
|---|---|---|---|
| THRU-1: Pre-trail fitness level | 6.77 | 6.29 | 6.51 |
| THRU-1: Pre-trail experience | 6.03 | 5.86 | 5.94 |
| THRU-1: Longest day | 42.43 mi / 68.28 km | 39.20 mi / 63.09 km | 40.80 mi / 65.66 km |
| THRU-1: Zero days | 13.41 | 22.70 | 18.2 |
| THRU-1: Nearo days | 12.5 | 17.59 | 15.09 |
| THRU-1: Resupply stops | 26.46 | 28.68 | 27.63 |
| THRU-1: Resupply boxes | 8.09 | 8.08 | 8.09 |
| THRU-1: Base weight (start) | 16.66 lb / 7.557 kg | 17.23 lb / 7.815 kg | 16.94 lb / 7.684 kg |
| THRU-1: Base weight (end) | 14.53 lb / 6.591 kg | 15.33 lb / 6.954 kg | 14.91 lb / 6.763 kg |
| THRU-1: Amount spent on gear | $1,452 | $1,505 | $1,477 |
| THRU-1: Total amount spent | $6,994 | $6,035 | $6,561 |
| THRU-1: Pack size | 52.82 L | 55.61 L | 54.17 L |
| THRU-1: Sleeping bag rating | 17.04°F / -8.31°C | 16.61°F / -8.55°C | 16.81°F / -8.44°C |
| THRU-1: Pairs of shoes used | 4.46 | 4.84 | 4.65 |
Cheap vs. Expensive Hikes
How much does a Pacific Crest Trail thru-hike cost? A common question among prospective hikers, and a quite reasonable one to want some answer to.
That said, how much a PCT thru-hike costs is incredibly variable. This year, there were hikes that (supposedly) cost under $1,000 and hikes that cost upwards of $50,000 – quite the spread.
The average cost of a thru-hike? $6,561. The median cost of a thru-hike? $6,000. If we take this combined with the average length of a thru-hike, it comes out to approximately $1,300 per month (or ~$43/day).
Note: The data below is entirely from thru-hikers who completed the entire trail as it wouldn’t make sense to include anyone else.

| Cheap Hikes | Expensive Hikes | Overall | |
|---|---|---|---|
| THRU-1: Days on trail | 146.92 | 145.29 | 146.20 |
| THRU-1: Pre-trail fitness level | 6.62 | 6.42 | 6.51 |
| THRU-1: Pre-trail experience | 6.13 | 5.78 | 5.94 |
| THRU-1: Longest day | 41.94 mi / 67.5 km | 40.88 mi / 65.79 km | 40.80 mi / 65.66 km |
| THRU-1: Zero days | 18.66 | 17.27 | 18.2 |
| THRU-1: Nearo days | 15.17 | 13.90 | 15.09 |
| THRU-1: Resupply stops | 27.54 | 27.16 | 27.63 |
| THRU-1: Resupply boxes | 8.04 | 8.29 | 8.09 |
| THRU-1: Base weight (start) | 16.73 lb / 7.589 kg | 17.05 lb / 7.734 kg | 16.94 lb / 7.684 kg |
| THRU-1: Base weight (end) | 14.41 lb / 6.536 kg | 15.21 lb / 6.899 kg | 14.91 lb / 6.763 kg |
| THRU-1: Amount spent on gear | $1,481 | $1,486 | $1,477 |
| THRU-1: Pack size | 54.43 L | 53.30 L | 54.17 L |
| THRU-1: Sleeping bag rating | 17°F / -8.33°C | 16.79°F / -8.45°C | 16.81°F / -8.44°C |
| THRU-1: Pairs of shoes used | 4.66 | 4.58 | 4.65 |
More on how much it costs to hike the Pacific Crest Trail here.
Light vs. Heavy Base Weight
If you’ve never thru-hiked before, you might think (based on internet chatter) that the gear you start the trail with will ultimately determine whether or not you end up completing the trail. While there are arguments to be made in favor of this, the issue is less what you start with and more whether you’re willing (and able) to adapt and admit that pre-hike you didn’t know all that middle-of-hike you knows.
The average base weight for thru-hikers (who completed the trail) was 17.78 lbs / 8.06 kg at the start of the PCT and 14.91 lbs / 6.76 kg at the end of the PCT. Here’s how the two groups (split up based on pre-hike base weight) stacked up.
For more on PCT Gear, check out the PCT Survey Gear Guide.

| Light Packs | Heavy Packs | Overall | |
|---|---|---|---|
| Completion percentage | 61.19% | 51.84% | 57.10% |
| THRU-1: Days on trail | 151.69 | 152.96 | 152.19 |
| THRU: Pre-trail fitness level | 6.45 | 5.09 | 6.26 |
| THRU: Pre-trail experience | 6.01 | 5.78 | 5.61 |
| THRU-1: Longest day | 41.15 mi / 66.22 km | 40.27 mi / 64.81 km | 40.80 mi / 65.66 km |
| THRU-1: Zero days | 18.26 | 18.11 | 18.2 |
| THRU-1: Nearo days | 15.67 | 14.24 | 15.09 |
| THRU-1: Resupply stops | 27.82 | 27.33 | 27.63 |
| THRU-1: Resupply boxes | 7.82 | 8.49 | 8.09 |
| THRU: Amount spent on gear | $1,572 | $1,532 | $1,555 |
| THRU-1: Amount spent on hike | $6,217 | $7,081 | $6,383 |
| THRU: Pack size | 52.11 L | 58.67 L | 54.17 L |
| THRU: Sleeping bag rating | 16.63°F / -8.54°C | 17.26°F / -8.19°C | 16.81°F / -8.44°C |
| THRU: Pairs of shoes used | 4.67 | 4.63 | 4.65 |
The Overall Highs & Lows
Now, let’s take a look at which group of hikers had the highest and lowest value for each of the descriptors above. Some of these make sense – the “Short Hikes” contingency had the fewest number of zero days while “Long Hikes” had the most zero days. Other stats are a bit more puzzling – why “Long Hikes” somehow was the lowest-spending group of hikers is strange. Maybe they rested more on the trail and so they were less in need of hotels in town (hotels can be a very expensive part of trail life).
Take a look and let me know what you think.
| Lowest | Highest | Overall | |
|---|---|---|---|
| Completion percentage | Hikers > 60 13.04% | Hikers < 30 62.18% | 57.10% |
| THRU-1: Days on trail | Male Hikers 132.39 | Hikers > 60 170 | 152.19 |
| Pre-trail fitness level | Heavy Packs 5.09 | Hikers > 60 6.68 | 6.26 |
| THRU-1: Longest day | Hikers > 60 31.78 mi / 51.14 km | Short Hikes 42.43 mi / 68.28 km | 40.80 mi / 65.66 km |
| THRU-1: Zero days | Short Hikes 13.41 | Long Hikes 22.70 | 18.2 |
| THRU-1: Nearo days | Hikers > 60 8.75 | Long Hikes 17.59 | 15.09 |
| THRU-1: Resupply stops | Hikers 40-49 25.50 | Long Hikes 28.68 | 27.63 |
| THRU-1: Resupply boxes | International Hikers 7.02 | Hikers 50-59 10.25 | 8.09 |
| Base weight (start) | Experienced Hikers 16.40 lb / 7.439 kg | Hikers > 60 20.8 lb / 9.435 kg | 17.78 lb / 8.06 kg |
| THRU-1: Base weight (end) | Experienced Hikers 14.35 lb / 6.509 kg | Hikers > 60 18.22 lb / 8.264 kg | 14.91 lb / 6.763 kg |
| Amount spent on gear | Female Hikers $1,420 | International Hikers $1,628 | $1,477 |
| THRU-1: Total amount spent | Long Hikes $6,035 | Hikers 40-49 $7,105 | $6,561 |
| Pack size | Light Packs 52.11 L | Hikers 50-59 58.91 L | 54.89 L |
| Sleeping bag rating | Female Hikers 14.56°F / -9.69°C | Hikers 40-49 18.62°F / -7.43°C | 16.9°F / -8.38°C |
| THRU-1: Pairs of shoes used | Short Hikes 4.46 | Hikers 50-59 5.13 | 4.65 |
Leave a comment and let me know if you what you find to be useful, interesting, or if there’s something you would like to see included in the future.

So what are the odds that we will be able to get a long distance permit for 2021? And what will happen if we cannot? I was never asked to show my permit in 2020 but I was asked if I had one by one ranger near Benson Pass.
I will have some insight into the number of people wanting to hike in 2021 as I am also conducting a survey of this year’s class (including people who intended to hike this year but who did not).
If you don’t get a long-distance permit, you’ll have to get permits for each area individually.