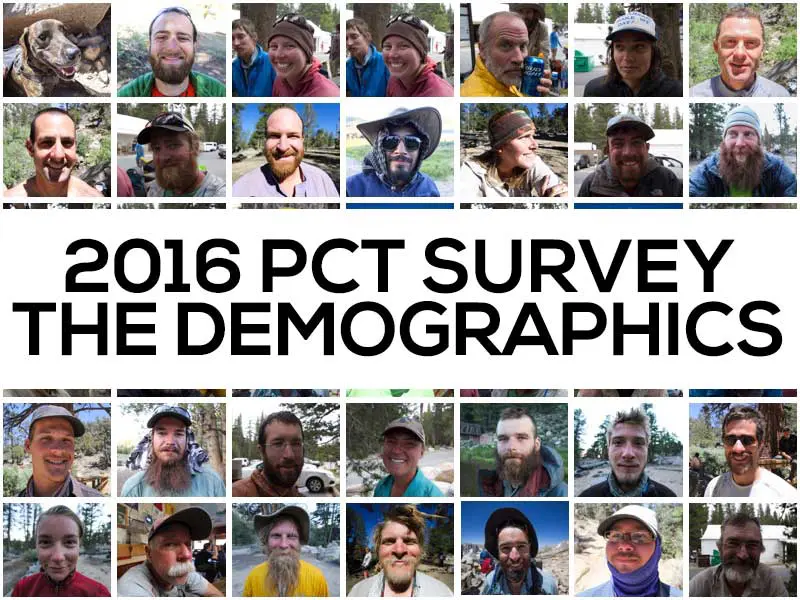
PCT Class of 2016 Survey: The Demographics
We’ve already broken down the Pacific Crest Trail Class of 2016’s gear and resupply, so now it’s time to take a closer look at the demographics (and miscellaneous data points) from this last year’s PCT class.
A lot of the data here is more along the lines of, “Hmmm…I think this would be an interesting thing to look at,” as opposed to something that might actually assist you in completing the Pacific Crest Trail.
The data points we examine are: sex, age, average start date, days on the trail, fitness level, the longest day, zero days, near-o days, resupply stops, resupply boxes sent, pairs of shoes used, starting base weight, ending base weight, the amount spent on gear, and amount spent on the entire hike.
Not sure what one or more of the terms listed above means? Check out the thru-hiker glossary.
The comparisons below are:

- Male vs. Female Hikers
- Young vs. Old Hikers
- Domestic vs. International Hikers
- First Timers vs. Experienced Hikers
- Fast vs. Slow Hikes
- Cheap vs. Expensive Hikes
- Light vs. Heavy Packs
- Overall Best And Worst
If at any point you find yourself wondering, “It would be interesting to see how X compares to Y,” then let me know in a comment or via message and I may be able to add it to the collection.
NOTE: if some of the “overall” numbers look strange in relation to the categories it’s because the overall stat includes all hikers in the group while the other numbers may only include the finishers (e.g. the ages of hikers in the “Fast vs. Slow Hikes”).
MALE VS. FEMALE
First let’s break the data down in a simple and relatable fashion: male vs. female hikers.
Of the hikers surveyed, 33% of respondents identified as female, while the remaining 67% all identified as male.
Here’s what I came up with:

| FINISHERS | FEMALE | MALE | OVERALL |
|---|---|---|---|
| COMPLETION % | 72% | 78% | 76% |
| AGE | 32 | 34 | 34 |
| AVERAGE START DATE | April 20 | April 25 | April 23 |
| DAYS ON TRAIL | 146 | 146.38 | 143.84 |
| FITNESS LEVEL | 6.7 | 6.6 | 6.63 |
| LONGEST DAY (MI) | 35.63 | 37.75 | 37.17 |
| ZERO DAYS | 16.93 | 17.24 | 17.24 |
| NEAR-O DAYS | 16.15 | 12.70 | 13.78 |
| RESUPPLY STOPS | 27.26 | 26.29 | 26.61 |
| BOXES SENT | 13.82 | 11.57 | 12.20 |
| PAIRS OF SHOES USED | 4.6 | 4.1 | 4.25 |
| BASE WEIGHT (START) | 17.74 lbs 8.06 kg |
20.43 lbs 9.29 kg |
18.21 lbs 8.28 kg |
| BASE WEIGHT (END) | 15.67 lbs 7.12 kg |
16.89 lbs 7.68 kg |
15.53 lbs 7.06 kg |
| $ SPENT ON GEAR | $1,563.43 | $1,685.41 | $1,659.18 |
| $ SPENT ON HIKE | $5,803.79 | $6,155.59 | $6,087.41 |
Of all the comparisons made in this post, female hikers made the most resupply stops (27.26) and used the highest number of shoes on their hikes (4.6).
Male hikers had the heaviest starting base weight (20.43 lbs / 9.29 kg) and the heaviest ending base weight (16.89 lbs / 7.68 kg).


YOUNG VS. OLD
The average age of survey respondents was 34. Here, I split the data into two groups: those thirty-four and older, and those thirty-three and younger.
Will this help you plan your hike? Probably not. Is it interesting to look at? Yes. Funny to see the two groups spent (nearly) the exact same amount on gear before their hikes.

| FINISHERS | UNDER 34 | 34 AND OVER | OVERALL |
|---|---|---|---|
| COMPLETION % | 81% | 67% | 76% |
| MALE/FEMALE % | 66/34 | 73/27 | 67/33 |
| AVERAGE START DATE | April 25 | April 19 | April 23 |
| DAYS ON TRAIL | 142.96 | 147 | 144 |
| FITNESS LEVEL | 6.62 | 6.65 | 6.63 |
| LONGEST DAY (MI) | 38.2 | 34.81 | 37.17 |
| ZERO DAYS | 17.69 | 16.11 | 17.24 |
| NEAR-O DAYS | 14.33 | 12.32 | 13.78 |
| RESUPPLY STOPS | 26.73 | 26.28 | 26.61 |
| BOXES SENT | 11.42 | 13.65 | 12.20 |
| PAIRS OF SHOES USED | 4.13 | 4.48 | 4.25 |
| BASE WEIGHT (START) | 18.25 lbs 8.3 kg |
18.14 lbs 8.25 kg |
18.21 lbs 8.28 kg |
| BASE WEIGHT (END) | 15.39 lbs 7 kg |
15.83 lbs 7.2 kg |
15.53 lbs 7.06 kg |
| $ SPENT ON GEAR | $1,600.10 | $1,600 | $1,659.18 |
| $ SPENT ON HIKE | $6,005.16 | $6,289.13 | $6,087.41 |
Of all the comparisons made in this post, older hikers had the lowest completion percentage (67%) and the shortest average longest day (34.81 mi / 56.02 km).
Younger hikers had the highest percentage of female hikers (34%).
DOMESTIC VS. INTERNATIONAL
This year I received responses from hikers coming from twenty-four countries (including the US).
COUNTRIES: Australia, Canada, Croatia, Czech Republic, Denmark, England, Finland, France, Germany, Greece, India, Israel, Italy, Mexico, Netherlands, New Zealand, Poland, Russia, Scotland, South Africa, Sweden, Switzerland, UK, USA
TOP SEVEN COUNTRIES
- USA 69.84%
- Canada 7.41%
- Australia 4.50%
- UK 3.70%
- France 3.17%
- Germany 2.91%
- Netherlands 1.32%
TOP SEVEN STATES
- California 22.34%
- Washington 14.65%
- Oregon 9.16%
- Colorado 4.03%
- New Hampshire 3.66% (T)
- New York 3.66% (T)
- Texas 3.66% (T)
| FINISHERS | USA | INTERNATIONAL | OVERALL |
|---|---|---|---|
| COMPLETION % | 74% | 81% | 76% |
| MALE/FEMALE % | 67/33 | 72/28 | 67/33 |
| AGE | 34 | 33 | 34 |
| START DATE | April 24 | April 22 | April 23 |
| DAYS ON TRAIL | 143.41 | 145.35 | 144 |
| FITNESS LEVEL | 6.79 | 6.3 | 6.63 |
| LONGEST DAY (MI) | 36.81 | 37.73 | 37.17 |
| ZERO DAYS | 16.04 | 19.33 | 17.24 |
| NEAR-O DAYS | 13.56 | 14.06 | 13.78 |
| RESUPPLY STOPS | 26.98 | 25.82 | 26.61 |
| BOXES SENT | 13.96 | 8.87 | 12.20 |
| PAIRS OF SHOES USED | 4.4 | 3.95 | 4.25 |
| BASE WEIGHT (START) | 17.51 lbs 7.96 kg |
19.56 lbs 8.89 kg |
18.21 lbs 8.28 kg |
| BASE WEIGHT (END) | 15.03 lbs 6.83 kg |
16.49 lbs 7.5 kg |
15.53 lbs 7.06 kg |
| $ SPENT ON GEAR | $1,564.66 | $1,802.16 | $1,659.18 |
| $ SPENT ON HIKE | $5,677.70 | $6,749.44 | $6,087.41 |
Of all the comparisons made in this post, domestic hikers were pretty average.
However, international hikers had the lowest average starting fitness level (6.3), the lowest number of resupply stops (25.82), sent the fewest number of resupply boxes (8.87), used the fewest number of shoes (3.95), and spent the most on their thru-hikes ($6,749.44).



FIRST-TIMERS VS. EXPERIENCED
Of the hikers on the trail this year, 73% were taking on their first long-distance trail and 27% had experience on one or more previous long-distance hikes.
The trails most commonly hiked by those with experience were:
- 32% Appalachian Trail
- 24% John Muir Trail
- 12% Pacific Crest Trail
- 5% Colorado Trail
- 3% Camino de Santiago
- 3% Arizona Trail
- 3% Long Trail
- 2% Continental Divide Trail
- 2% PCT Section Hike
- 14% Other Long-distance Trail

| FINISHERS | FIRST LONG-DISTANCE THRU-HIKE | PREVIOUS THRU-HIKE | OVERALL |
|---|---|---|---|
| COMPLETION % | 74% | 82% | 76% |
| MALE/FEMALE % | 68/32 | 72/28 | 67/33 |
| AGE | 32 | 37 | 34 |
| START DATE | April 24 | April 22 | April 23 |
| DAYS ON TRAIL | 145.71 | 140.22 | 144 |
| FITNESS LEVEL | 6.64 | 6.59 | 6.63 |
| LONGEST DAY (MI) | 37.22 | 36.88 | 37.17 |
| ZERO DAYS | 17.51 | 16.30 | 17.24 |
| NEAR-O DAYS | 14.04 | 12.99 | 13.78 |
| RESUPPLY STOPS | 26.33 | 27.18 | 26.61 |
| BOXES SENT | 12.18 | 12.38 | 12.20 |
| PAIRS OF SHOES USED | 4.28 | 4.16 | 4.25 |
| BASE WEIGHT (START) | 19.20 lbs 8.73 kg |
15.91 lbs 7.23 kg |
18.21 lbs 8.28 kg |
| BASE WEIGHT (END) | 15.93 lbs 7.24 kg |
14.58 lbs 6.63 kg |
15.53 lbs 7.06 kg |
| $ SPENT ON GEAR | $1,683.22 | $1,557.38 | $1,659.18 |
| $ SPENT ON HIKE | $6,261.92 | $5,520.31 | $6,087.41 |
Of all the comparisons made in this post, first-time hikers were fairly average.
Experienced hikers had the highest completion percentage (82%), were the oldest (average age of 37), and had the lowest average starting base weight (15.91 lbs / 7.23 kg).
FAST VS. SLOW HIKES
How about people who hiked the trail quickly vs. those who took a bit more time to complete their thru-hikes?
Here we split and compare hikers based on the length of time it took them to finish the trail. The average number of days thru-hikers spent completing a thru-hike was 144 days (that’s just under five months).
I’ve divided hikes into “Fast Hikes” (quicker than 144 days) and “Slow Hikes” (those that took 144 days or longer).
| FINISHERS | FASTER HIKES | SLOWER HIKES | OVERALL |
|---|---|---|---|
| MALE/FEMALE % | 74/26 | 67/33 | 67/33 |
| AGE | 31 | 33 | 34 |
| START DATE | May 1 | April 17 | April 23 |
| FITNESS LEVEL | 7 | 6.32 | 6.63 |
| LONGEST DAY (MI) | 39.80 | 35.04 | 37.17 |
| ZERO DAYS | 12.03 | 20.99 | 17.24 |
| NEAR-O DAYS | 11.66 | 15.58 | 13.78 |
| RESUPPLY STOPS | 26.38 | 26.67 | 26.61 |
| BOXES SENT | 11.45 | 12.77 | 12.20 |
| PAIRS OF SHOES USED | 4.19 | 4.31 | 4.25 |
| BASE WEIGHT (START) | 16.92 lbs 7.69 kg |
18.99 lbs 8.63 kg |
18.21 lbs 8.28 kg |
| BASE WEIGHT (END) | 14.23 lbs 6.47 kg |
16.54 lbs 7.52 kg |
15.53 lbs 7.06 kg |
| $ SPENT ON GEAR | $1,522 | $1,751.73 | $1,659.18 |
| $ SPENT ON HIKE | $5,371.21 | $6,580.04 | $6,087.41 |
Of all the comparisons made in this post, faster hikes had the latest average start date (May 1), the highest average level of fitness (7), the longest average day (39.80 mi / 64.05 km), took the fewest zero days (12.03), took the fewest near-o days (11.66), the lowest average ending base weight (14.23 lbs / 6.47 kg), and were the cheapest overall ($5,371.21).
Slower hikes had the earliest average start date (April 17), took the most zero days (20.99), and took the most near-o days (15.58).


CHEAP VS. EXPENSIVE
Now to an issue that many future thru-hikers concern themselves with: how much will it cost to hike the Pacific Crest Trail (and how much should they spend)?
Will spending a lot of money on a thru-hike make it more successful? Enjoyable? Sexy? Probably not. But if you’re looking to spend less on a thru-hike, then it would appear that completing your hike as quickly as possible (and not taking many days off) would be in your best interest.
The average cost of a completed thru-hike this year was $6,087.41, and that’s where I divided the survey respondents into the categories of “Cheaper Hikes” and “Expensive Hikes.”
| FINISHERS | CHEAPER HIKES | EXPENSIVE HIKES | OVERALL |
|---|---|---|---|
| MALE/FEMALE % | 66/34 | 75/25 | 67/33 |
| AGE | 32 | 35 | 34 |
| START DATE | April 25 | April 19 | April 23 |
| DAYS ON TRAIL | 139.6 | 151.82 | 144 |
| FITNESS LEVEL | 6.70 | 6.41 | 6.63 |
| LONGEST DAY (MI) | 37.45 | 37.34 | 37.17 |
| ZERO DAYS | 16.03 | 20.47 | 17.24 |
| NEAR-O DAYS | 13.16 | 15.40 | 13.78 |
| RESUPPLY STOPS | 26.03 | 26.87 | 26.61 |
| BOXES SENT | 12.03 | 11.34 | 12.20 |
| PAIRS OF SHOES USED | 4.15 | 4.39 | 4.25 |
| BASE WEIGHT (START) | 18.28 lbs 8.31 kg |
18.42 lbs 8.37 kg |
18.21 lbs 8.28 kg |
| BASE WEIGHT (END) | 15.34 lbs 6.97 kg |
16.08 lbs 7.3 kg |
15.53 lbs 7.06 kg |
| $ SPENT ON GEAR | $1,440.78 | $2,095.13 | $1,659.18 |
Of all the comparisons made in this post, cheap hikes were the shortest (139.6 days) and spent the least on gear ($1,440.78).
Expensive hikes had the fewest number of female hikers (25%), were the longest (151.82 days) and spent the most on gear ($2,095.13).
More on how much it costs to hike the Pacific Crest Trail here.
LIGHT VS. HEAVY PACKS
And now to the proverbial thru-hiker dick-measuring competition: pack weight.
The average starting base weight for this year’s PCT thru-hiking class was 18.21 lbs / 8.28 kg and the average ending base weight was 15.53 lbs / 7.06 kg.
I split this section based on starting base weight. What did we find out here? Well, nothing really. I suggest taking a look at this year’s gear guide instead of trying to glean any information from this chart.
| FINISHERS | LIGHTER PACKS | HEAVIER PACKS | OVERALL |
|---|---|---|---|
| COMPLETION % | 81% | 68% | 76% |
| MALE/FEMALE % | 67/33 | 73/27 | 67/33 |
| AGE | 31 | 34 | 34 |
| START DATE | April 22 | April 22 | April 23 |
| DAYS ON TRAIL | 142.07 | 149.32 | 144 |
| FITNESS LEVEL | 6.67 | 6.46 | 6.63 |
| LONGEST DAY (MI) | 37.49 | 36.72 | 37.17 |
| ZERO DAYS | 16.46 | 19.63 | 17.24 |
| NEAR-O DAYS | 13.94 | 14.21 | 13.78 |
| RESUPPLY STOPS | 26.95 | 26.25 | 26.61 |
| BOXES SENT | 13.03 | 11.26 | 12.20 |
| PAIRS OF SHOES USED | 4.33 | 4.11 | 4.25 |
| $ SPENT ON GEAR | $1,671.05 | $1,720.97 | $1,659.18 |
| $ SPENT ON HIKE | $6,172.34 | $6,154.29 | $6,087.41 |
Interestingly enough, there’s nothing really of note about the light vs. heavy packs comparison.


OVERALL
Lastly, we take a look at which of the above groups had the lowest and highest averages from the overall pool of data.
To be honest, most of the data below makes a lot of sense (or I am just incredibly illogical). For example, international hikers spent the most on their hikes (an average of $800) – could this be the cost of airfare? Faster hikes had the fewest zero and near-o days – yup, checks out. Cheaper hikes had the least amount spent on gear; expensive hikes had the most.
Leave a comment below and let me know if you find anything fitting and accurate or perhaps out-of-place and mysterious.
| FINISHERS | LOWEST | HIGHEST | OVERALL |
|---|---|---|---|
| COMPLETION % | OLDER HIKERS 67% |
EXPERIENCED HIKERS 82% |
76% |
| MALE/FEMALE % | EXPENSIVE HIKES 75/25 |
YOUNGER HIKERS 66/34 |
67/33 |
| AGE | QUICKER HIKES + LIGHTER PACKS 31 |
EXPERIENCED HIKERS 37 |
34 |
| START DATE | SLOWER HIKES April 17 |
FASTER HIKES May 1 |
April 23 |
| DAYS ON TRAIL | CHEAP HIKES 139.6 |
EXPENSIVE HIKES 151.82 |
144 |
| FITNESS LEVEL | INTERNATIONAL HIKERS 6.3 |
FASTER HIKES 7 |
6.63 |
| LONGEST DAY | OLDER HIKERS 34.81 mi / 56.02 km |
FASTER HIKES 39.80 mi / 64.05 km |
37.17 mi 59.82 km |
| ZERO DAYS | FASTER HIKES 12.03 |
SLOWER HIKES 20.99 |
17.24 |
| NEAR-O DAYS | FASTER HIKES 11.66 |
SLOWER HIKES 15.58 |
13.78 |
| RESUPPLY STOPS | INTERNATIONAL HIKERS 25.82 |
FEMALE HIKERS 27.26 |
26.61 |
| BOXES SENT | INTERNATIONAL HIKERS 8.87 |
DOMESTIC HIKERS 13.96 |
12.20 |
| PAIRS OF SHOES USED | INTERNATIONAL HIKERS 3.95 |
FEMALE HIKERS 4.6 |
4.25 |
| BASE WEIGHT (START) | EXPERIENCED HIKERS 15.91 lbs / 7.23 kg |
MALE HIKERS 20.43 lbs / 9.29 kg |
18.21 lbs 8.28 kg |
| BASE WEIGHT (END) | FASTER HIKES 14.23 lbs / 6.47 kg |
MALE HIKERS 16.89 lbs / 7.68 kg |
15.53 lbs 7.06 kg |
| $ SPENT ON GEAR | CHEAPER HIKES $1,440.78 |
EXPENSIVE HIKES $2,095.13 |
$1,659.18 |
| $ SPENT ON HIKE | FASTER HIKES $5,371.21 |
INTERNATIONAL HIKERS $6.749.44 |
$6,087.41 |



I’m curious about race demographics! Have you thought about adding that to your survey? Thanks!
On the list for next year!
Hey Mac – thanks for crunching the numbers. I’m curious what exactly is factored in to $ spent on gear? Gear obtained pre-hike, or during? Are shoes factored into that number? Is travel to the trail factored into the total cost of the hike? Phone bills, travel insurance? Who are these people, cause it sure seems crazy to spend 6 g’s hiking for 5 months when your main expenses are food, possibly medical attention, the occasional hotel, shoe replacement, and of course travel to the trail. Never knew anyone who spent even close to this number on their hikes before.
I didn’t specify any parameters for “$ Spent On Gear” or “$ Spent On Hike” so your guess is as good as mine. $6,000 for five months of hiking (including gear) doesn’t seem too crazy to me and I know plenty of people who spent this much (or more).
Quick question: in these numbers, does “$ Spent on Hike” include “$ Spent on Gear”?
$ = Dollars