The Pacific Crest Trail Thru-Hiker Survey (2019)
Check out the most recent PCT Survey results here.
Welcome to the results of the 2019 Pacific Crest Trail Thru-hiker Survey!
The PCT Survey is now in its seventh year and I would like to extend a huge THANK YOU to everyone who took the time to participate. You’re all champions of life. And thank you, dear reader, for being patient while waiting for this year’s results. As a reward for your patience, we have the largest sample size ever from a PCT class (more on this below).
I started the PCT Survey to create a resource that would (actually) be useful to those of you interested in hiking the Pacific Crest Trail. After being out on the PCT myself for two months this year, I am happy to have heard firsthand that this mission has been a success. That said, each year I try to improve data collected and fine-tune the presentation to best help hikers. I would love to hear what you think via comment or email.
A WORD OF WARNING: The data is not going to be 100% guaranteed accurate. Despite my best efforts, there’s nothing scientific about my data collection or presentation. Every year, I get an email from someone criticizing my methods. Remember, I’m just a random guy on the internet trying to help out PCT hikers; take it easy.
Congratulations on now arriving at a spot in the PCT Survey that most readers have probably skipped. Here are the results of Halfway Anywhere’s 2019 Pacific Crest Trail Thru-hiker Survey!
JUMP TO A SECTION
Notes on the data
- This year we had 846 completed surveys – that’s a 68% increase vs. last year and the most respondents in the history of the survey.
- Some responses have been sorted and colored to present the data in a friendlier manner (e.g. northbound vs. southbound responses).
- Not all PCT hikers meticulously document the stats of their thru-hike (yes, I’m weird). Therefore, the data is not going to be 100% accurate. That said, it should be fairly close to the reality of the trail this year.
- I refer to survey respondents collectively as this year’s “class“. Remember, this is a sample and not a comprehensive survey of every single PCT hiker on the trail this year.
- If you find a small and meaningless discrepancy in the data, congratulations. However, if you find a large or obvious error, please let me know and it will be corrected.
- If you’re wondering what this symbol – σ – is, it’s the symbol for standard deviation. If you don’t know what that is, I invite you to use the Google.
- For stats requiring the length of the PCT for a calculation (e.g. average mileage per day over the course of the trail), I use 2,660 mi / 4,280 km.
- I will be releasing more detailed survey posts focused on PCT Gear, PCT Resupply, PCT Demographics, PCT Horror Stories, and PCT Advice in the coming weeks. If you would like to be notified of new surveys, click here.
LABELS differentiating hiker segments:
- THRU: Thru-hikers (all)
- THRU-0: Thru-hikers who did NOT complete the PCT
- THRU-1: Thru-hikers who completed the entire PCT
- NOBO: Northbound thru-hikers (all)
- NOBO-0: Northbound thru-hikers who did NOT complete the PCT
- NOBO-1: Northbound thru-hikers who completed the PCT
- SOBO: Southbound thru-hikers (all)
- SOBO-0: Southbound thru-hikers who did NOT complete the PCT
- SOBO-1: Southbound thru-hikers who completed the PCT
If NO LABEL has been appended to a data point, then I used all data collected (i.e. it also includes section hiker data).
SOUTHBOUND DATA: I received responses from 81 southbound thru-hikers. This is more than DOUBLE last year!
The PCT Demographics
Our first section won’t help you prepare for a PCT thru-hike, but that doesn’t mean it isn’t interesting. Here are the HIKER DEMOGRAPHICS.
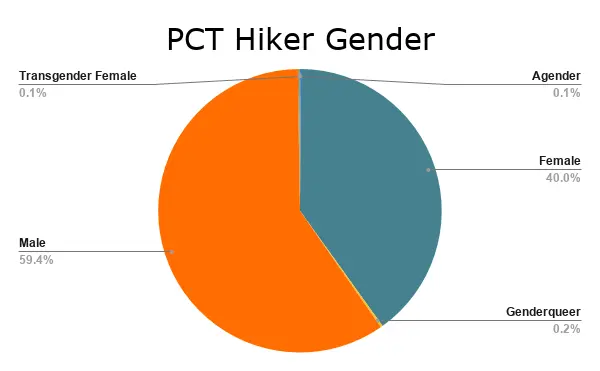
PCT thru-hiker GENDER
- 59.4% Male
- 40% Female
- 0.2% Genderqueer
- 0.1% Transgender Female
- 0.1% Agender
PCT thru-hiker AGE
- 1.58% < 20
- 14.7% 20-24
- 30.13% 25-29
- 17.86% 30-34
- 10.45% 35-39
- 7.65% 40-49
- 9.23% 50-59
- 7.65% 60-69
- 0.73% >70
Average age: 35 (σ = 13)

PCT thru-hiker RACE
- 92.4% White
- 2.4% Asian
- 2.4% 2+ Races
- 1.8% Hispanic or Latino
- 0.5% American Indian or Alaskan Native
- 0.2% African American
- 0.1% Native Hawaiian or Other Pacific Islander

PCT thru-hiker EDUCATION
- 48.9% Bachelor’s degree
- 20.2% Master’s degree
- 12.8% Some college (no degree)
- 6% High school or equivalent
- 5% Postgraduate degree
- 4.9% Associate degree
- 2.2% Did not graduate high school

PCT thru-hiker COUNTRIES
- Australia, Austria, Belgium, Brazil, Brunei, Canada, China, Croatia, Czechia, Denmark, Estonia, Finland, France, Germany, Hungary, India, Ireland, Israel, Italy, Netherlands, New Zealand, Norway, Poland, Portugal, Russia, Slovenia, South Africa, Sweden, Switzerland, Taiwan, United Kingdom, United States (32 TOTAL)
A look at PCT hiker distribution across the world – we’ve got representation from every continent (sorry, Antarctica, you don’t get to count as a continent for PCT Survey purposes.
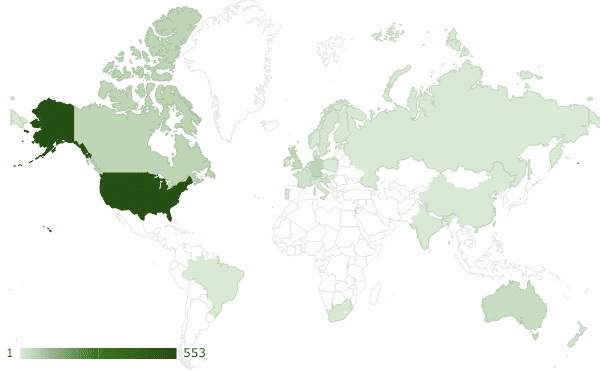
Since the USA dominates the world distribution, here’s a closer look at where hikers come from across the Atlantic in Europe (the second-most represented continent on the trail).

PCT thru-hiker US STATES
- AK, AL, AZ, CA, CO, CT, FL, GA, HI, IA, ID, IL, IN, KS, KY, LA, MA, MD, ME, MI, MN, MO, MS, MT, NC, ND, NE, NH, NJ, NM, NV, NY, OH, OK, OR, PA, SC, SD, TN, TX, UT, VA, VT, WA, WI, WY (46 TOTAL – where you at Arkansas, Delaware, Rhode Island, and West Virginia?)
- We also had a hiker from Puerto Rico this year (which is part of the United States)

MOST-REPRESENTED COUNTRIES
MOST-REPRESENTED US STATES
- California – 22%
- Washington – 12.4%
- Oregon – 8.2%
- Colorado – 4%
- Texas – 3.6%
- Minnesota – 3.3%
- New York – 3.1%
- Illinois/Michigan – 2.7%
- Ohio – 2.6%
The PCT Thru-hiking Basics
Now things start to get a bit more interesting (and useful for those of you in the “Planning a PCT Hike” phase).
This section examines HIKER EXPERIENCE, HIKER FITNESS, PCT PERMITS, HIKING STATUS, RELATIONSHIP STATUS, and PCT DAYS.
First long-distance hike?
- 68% Yes
- 32% No
Of this year’s thru-hikers, 71% were on their first long-distance hike and 29% had previously completed a long-distance hike.

This year, I also asked hikers to rate their level of backpacking experience (on a scale of 1 to 10) prior to beginning the trail. Here’s what we came up with for thru-hikers:
- 5.6 – average experience
- σ = 2.96
THRU-1: 5.94 (σ = 3.02)
THRU-0: 5.14 (σ = 2.82)

The trails most commonly hiked by those with experience were:
- 10.43% Appalachian Trail
- 6.52% John Muir Trail
- 6.28% Camino de Santiago
- 3.44% Pacific Crest Trail
- 2.37% Tahoe Rim Trail
- 2.37% Te Araroa
- 2.01% Colorado Trail
- 1.90% Long Trail
- 1.66% GR20
- 1.18% High Sierra Trail
- 1.18% Kungsleden
- 0.95% Continental Divide Trail
- 0.71% PCT Section Hike
- 0.71% Tour du Mont Blanc
- 0.71% Pacific Northwest Trail
- 0.36% Arizona Trail
- 0.24% Grand Enchantment Trail
- 0.12% Florida Trail
- 9.24% Other Trail

The most common trail this year’s Pacific Crest Trail Class had experience with was (once again) the Appalachian Trail.
While we’re on the topic of experience, let’s look at whether this year’s class TRAINED prior to their thru-hikes and how they RATED THEIR FITNESS before beginning their hikes.
Did you train before your hike?
- 63% Yes
- 37% No
Of this year’s thru-hikers, 63% reported having trained beforehand.

I asked hikers to rate their level of fitness (on a scale of 1 to 10) prior to beginning the trail. Here’s what we came up with for thru-hikers:
- 6.26 – average fitness level
- σ = 1.58
THRU-1: 6.51 (σ = 1.43)
THRU-0: 5.92 (σ = 1.63)

The question of how much money is required for a thru-hike is one that gets asked by a lot of would-be PCT thru-hikers each year. Sure, I may have written a post on the subject, but there’s nothing better than hard data.
THRU-1
$6,561
The average amount spent on the entirety of a thru-hike
(σ = $4,607)
THRU-1
$38.68
The average amount spent per day on a thru-hike
(σ = $35.13)
THRU-1
$1,477
The average amount spent on gear prior to starting
(σ = $807)
Beginning a thru-hike on your own can sound scary and intimidating, but it turns out the majority of thru-hikers (and hikers in general) began their hikes alone.
Did you begin your hike alone?
- 64.7% Yes
- 17.6% Began with a partner or spouse
- 15% Began with a friend
- 2.7% Arranged to start with other hikers (whom they had not met prior to beginning the PCT)
Of this year’s first-time thru-hikers, 63.8% began their hikes alone.


What percentage of the time did you spend HIKING alone?
- 5.40% – < 10% of the time
- 6.50% – 10-25% of the time
- 13.7% – 25-50% of the time
- 16.5% – 50-75% of the time
- 32.1% – 75-90% of the time
- 26.2% – > 90% of the time
60.22% – Average amount of time thru-hikers, spent hiking alone (σ = 30.2)
Hiking alone here measures the amount of time that hikers weren’t physically walking with someone down the trail – not necessarily that they weren’t hiking with others over the course of the day.

What percentage of the time did you CAMP alone?
- 23.0% – 0% of the time
- 28.2% – 1-5% of the time
- 9.30% – 6-10% of the time
- 7.40% – 11-20% of the time
- 5.60% – 21-30% of the time
- 10.6% – 31-50% of the time
- 9.00% – 51-75% of the time
- 3.80% – 76-90% of the time
- 3.10% – > 90% of the time
21.5% – Average percentage of nights thru-hikers, spent camping alone (σ = 25.5). When we look at thru-hikers who finished, this translates to an average of 29 nights spent camping alone.
But after all that hiking and camping, did PCT thru-hikers end up sticking with the people they started their adventures with? This year, I added a question to find out.
If you began your hike with someone else, did you remain with this person for the entirety of the trail?
- 61.2% Yes
- 13.7% No, we decided it wasn’t for the best
- 13.3% No, this was never the plan
- 8.70% Yes, for the most part
- 1.90% No, we were a couple and we’ve now broken up
- 1.10% No, and we are no longer friends

Yes, the PCT destroyed a total of 3% of hiker relationships (both romantic and friendly). If only we had more information about how hikers were torn apart and brought together by the trail. Well, friend, I have good news – we do! This year I also added a question regarding hiker relationship status before, during, and after hiking the trail. Here are all the juicy details:
When you began the trail, were you in a relationship?
- 47.1% No, and I am still single
- 42.1% Yes, and I am still with the same person
- 5.7% No, but now I am in a relationship with someone I met on the PCT
- 3.9% Yes, but I am now single
- 0.5% No, but now I am in a relationship with someone I met prior to the PCT
- 0.1% Yes, but now I am in (a different) relationship with someone I met prior to the PCT

The rules surrounding Pacific Crest Trail permits have been evolving since this survey began and next year will see even more permit regulation. That’s why I included questions on this year’s survey regarding the PCT Long-distance Permit and how hikers dealt with the challenges surrounding obtaining one and whether or not hikers respected the rules in place.
Did you obtain a long-distance PCT permit from the PCTA?
- 100% Yes
Honestly, I find this surprising – not unbelievable, just surprising. I told respondents this wasn’t an attempt to get anyone in trouble and that it was purely for the purposes of my survey, so I can only assume that everyone told the truth and got permits.
That said, obtaining a permit is one thing; beginning your PCT thru-hike on the date indicated on your permit is something else entirely. I also asked hikers whether they began their hikes on the date indicated on their permit. Here’s what we came up with:
Did you begin your hike on the date printed on your permit?
- 81.7% Yes
- 18.3% No

There’s the delinquent bunch I was looking for. Clearly, not everyone was happy with their permit date, so I also asked hikers if their permit was anything close to what they had hoped for.
Did you get a permit for the starting date you wanted?
- 65.9% Yes
- 9.20% +/- 2 days
- 13.4% +/- 5 days
- 11.5% No, unhappy with start date

The next section delves deeper into the all-important starting date (at least what many hikers consider to be all-important).
The PCT Start Dates
Every year hikers stress out about their start dates, and every couple of years the Pacific Crest Trail Association makes changes to the rules governing long-distance permits for the PCT (next year is one of these years).
It made more sense to present data reflecting the starting dates for PCT thru-hikers back when I began this survey in 2013. There was no quota in place for the southern (or northern) terminus, and the “ideal start date” had not been agreed upon by the thru-hiking community (but this is mostly because there is no “ideal start date”). That said, here is the information regarding the starting dates for PCT thru-hikers this year.
I’ve tried to expand upon the data here a bit to make it a bit more useful, but remember that only 50 long-distance permits are issued for the US-Mexico Border per day and it can be safely assumed the entire month of April and the first half of May will fill up first. Just remember that conditions on the PCT are different every year and just because starting at a particular time went well for one year’s class, doesn’t necessarily mean that it will be the best idea for the next year’s.
- April 15 – NOBO Average start date
- April 23 – NOBO Average start date for hikers who said they were happy with their start date
- April 4 – NOBO Average start date for hikers who said they would have liked to begin their hikes later
- May 11 – NOBO Average start date for hikers who said they would have liked to begin their hikes earlier
- June 10 – NOBO Average date reaching Kennedy Meadows
- 55.7 – NOBO Average number of days taken to reach Kennedy Meadows
- 12.6 mi / 20.28 km – NOBO Average daily distance between the southern terminus and Kennedy Meadows
- April 13 – NOBO-0 Average start date
- April 17 – NOBO-1 Average start date
- September 19 – NOBO-1 Average date reaching the northern terminus

THRU-1
152
The average length of a thru-hike
(σ = 23)
NOBO-1
155
The average length of a thru-hike
(σ = 22)
SOBO-1
129
The average length of a thru-hike
(σ = 18)
- June 27 – SOBO Average start date
- June 26 – SOBO Average start date for hikers who said they were happy with their start date.
- June 24 – SOBO Average start date for hikers who said they would have liked to begin their hikes later
- July 3 – SOBO Average start date for hikers who said they would have liked to begin their hikes earlier
- June 29 – SOBO-0 Average start date
- June 27 – SOBO-1 Average start date
- November 3 – SOBO-1 Average date reaching the southern terminus

The PCT Hiking
So far we’ve covered a lot of interesting information, but this is a survey about hiking – so we should probably talk about hiking.
This section delves into the HIKING STATS, including DAILY MILEAGE, the number of ZEROES/NEAR-OS taken, ALTERNATE ROUTES taken, and whether hikers FLIP-FLOPPED, hiked WHITNEY, hiked the ENTIRE PCT, or would hike the PCT AGAIN.
THRU-1
152.19
The average number of days of an entire thru-hike
(σ = 23.25)
THRU-1
134.97
The average number of days hiking (total minus zero days)
(σ = 20.8)
THRU-1
40.80 mi
The average longest day (65.66 km)
(σ = 9.30 mi / 14.97 km)
THRU-1
20.2 mi
The average daily mileage (32.51 km)
(σ = 3.83 mi / 6.16 km)
THRU-1
18.2
The average number of zero days
(σ = 9.64)
THRU-1
15.09
The average number or near-o days
(σ = 9.5)
Would you consider hiking the PCT again?
THRU
80.59% Yes
19.41% No
THRU-1
71.63% Yes
28.37% No
THRU-0
92.43% Yes
7.57% No
Did you flip-flop? (Flip-flopping is the act of skipping a section of trail and then coming back to complete the skipped section later in the hike)
THRU
34.6% Yes
65.4% No
NOBO
37.14% Yes
62.86% No
SOBO
12.99% Yes
87.01% No
If you flip-flopped, what was your reason for doing so?
- 85.7% Snow
- 4.90% Personal/Logistical
- 3.80% Injury
- 1.90% River crossings
- 1.90% To stay with friend(s)/partner
- 1.10% Trail Days
- 0.40% Visa Requirements
- 0.40% Weather

Of the people who flip-flopped this year, 85.7% of them did so due to snow. Safe to say this year was a high snow year on the PCT. When I first hiked the PCT in 2013 I encountered zero snow in the Sierra. Hiking the Sierra this year was a much different (and much more exciting) story.
I asked hikers if they encountered any problems due to the snowpack this year and here’s what I came up with.
Did you encounter any unforeseen problems because of snow?
- 58.1% – Yes
- 41.9% – No
Of those who responded “Yes”, here is the breakdown of the issues encountered:
- 45.50% – Flip-flopped
- 31.18% – Didn’t have the proper experience
- 29.33% – Skipped a section
- 18.01% – Didn’t have the proper gear
- 3.93% – Delayed hike

Most people who begin thru-hikes of the Pacific Crest Trail do so with the intention of completing the entirety of the hike. Unfortunately (or in some cases, fortunately), not everyone who sets out on this most epic adventure of border-to-border glory will complete the entirety of the trail. In fact, I can guarantee you that a large percentage of people expecting to hike the PCT next year (and every year), will fail to meet their expectations.
We’re going to take a look here at COMPLETION RATES, but we are doing so with a caveat. Since I distribute this survey myself, and because it is in no way required of PCT hikers, the survey respondents are a self-selecting group who (likely) skew toward having completed the trail. A hiker who quit during their first week of hiking back in April is probably paying much less attention and caring far less about a Pacific Crest Trail survey released in the fall. That said, it doesn’t mean we won’t still look at the data.
THRU
57.26%
The percentage of thru-hikers who completed the PCT.
NOBO
56.17%
The percentage of northbound thru-hikers who completed the PCT.
SOBO
65%
The percentage of southbound thru-hikers who completed the PCT.
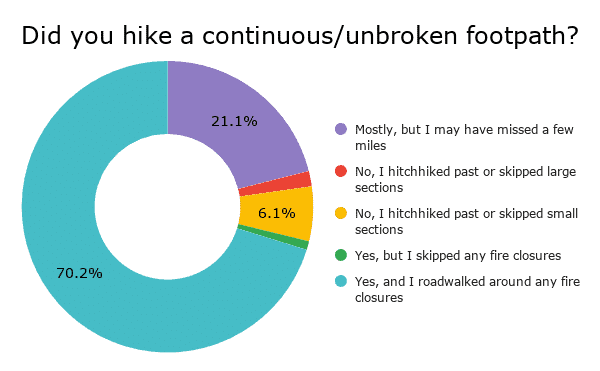
It may sound straightforward enough, “Did you complete the PCT? Yes or no?”, but what constitutes a finish isn’t necessarily the same for everyone. Some people insist you need to have unbroken steps between Mexico and Canada to constitute a thru-hike while others may forgive skipping a road walk or hitchhiking around a fire closure. To get a better idea of how much of the trail this year’s finishers hiked, I asked about their footsteps between the terminuses.
Did you hike a continuous and unbroken footpath between Mexico and Canada?
- 70.2% – Yes, and I road walked around any fire closures
- 1% Yes, but I skipped the fire closures
- 21.1% Mostly, but I may have missed a few miles
- 6.1% No, I skipped or hitched past small sections of trail
- 1.7% No, I skipped or hitched past large sections of trail
Despite the Pacific Crest Trail being a well-defined trail, there are a number of ALTERNATE TRAILS hikers can take either in lieu of or in addition to the official PCT. This year, I also asked about these alternates to get an idea of what the most common PCT thru-hikes looked like. Alternates are listed in geographical order from south to north.
I use the following colors to indicate the popularity of each alternate: OVER 75%, 50-75%, 25-50%, LESS THAN 25%.
DESERT ALTERNATES
- Spitler Trail (south of Idyllwild) – 3.5%
- South Ridge Trail (in and/or out of Idyllwild) – 2.4%
- Devils Slide Trail (in and/or out of Idyllwild) – 52.4%
- Deer Springs Trail (in and/or out of Idyllwild) – 6.1%
- Black Mountain Road (north of Idyllwild) – 2.6%
- Acorn Trail (in and/or out of Wrightwood) – 10.3%
- Buckhorn Camp Detour (north of Wrightwood) – 5.8%
- Upper Shake Campground – 1.2%
SIERRA ALTERNATES
- Cottonwood Pass Trail – 22.3%
- Whitney Portal Trail – 16.2%
- Kearsarge Pass Trail – 80.1%
- Sawmill Pass Trail – 0.7%
- Bishop Pass Trail – 10.3%
- Bear Ridge Trail (in and/or out of VVR) – 9.2%
- Goodale Pass Trail (in and/or out of VVR) – 3.5%
- Cascade/Fish Valley Trail – 0.5%
- Mammoth Pass Trail – 31%
- Devils Postpile Trail – 26.8%
- John Muir Trail (between Red’s Meadow and Thousand Island Lake) – 9.86%
- Tuolumne Campground Trail – 14.32%
NORTHERN CALIFORNIA ALTERNATES
- Bucks Lake Alternate – 3.3%
- Castella Trail – 4.23%
OREGON ALTERNATES
- Callahan’s Side Trail – 25.8%
- Hyatt Lake Restaurant – 4.5%
- Mazama Campground (Crater Lake) – 47.4%
- Crater Lake Rim Alternate – 87.1%
- Shelter Cove Trail – 51.4%
- Elk Lake Resort Trail – 19.5%
- Big Lake Youth Camp Trail – 57.8%
- Eagle Creek Trail – 0.47%
WASHINGTON ALTERNATES
- Stevenson Roadwalk – 0.2%
- Old PCT Route past Old Snowy Mountain – 27.2%
- Miram Clear Fork Fires Detour – 0.2%
- Goldmeyer Hot Springs Alternate – 7.8%
- Holman Fire Detour – 0.2%
Not an alternate, but instead a side trip (an out-and-back from the PCT), hikers on the Pacific Crest trail pass just west of Mount Whitney in the Southern Sierra. The highest peak in the Continental United States at 14,505 ft / 4,421 m, it’s a tempting investment of time that most hikers take advantage of (the trip up from the PCT is easier, shorter, and less crowded than the trip up from the Whitney Portal Trailhead on the eastern side).
Did you summit Mount Whitney?
- 44.11% – Yes
- 55.89% – No

But what of the hikers who failed to make it to the opposite border? What was it that stopped them? How far did they make it?
Why hikers didn’t complete the PCT this year:
- 30% Injury
- 24.9% Personal
- 21.6% Snow
- 5.9% Family
- 5.1% Work
- 5.1% Financial
- 3.3% Illness
- 2.2% Visa
- 0.4% School
- 0.4% Fires

The number of miles completed by hikers who didn’t finish the PCT
- 9.69% – < 500 mi / 805 km
- 20.4% – 500 to 1,000 mi / 805 to 1,609 km
- 25.3% – 1,000 to 1,500 mi / 1,609 km to 2,414 km
- 19.4% – 1,500 to 2,000 mi / 2,414 to 3,218 km
- 23.53% – 2,000 to 2,500 mi / 3,218 to 4,023 km
- 1.73% – > 2,500 mi / 4,023 km
Average: 1,361 mi / 2,190 km
σ = 655 mi / 1,054 km

Every year there’s an event held in Cascade Locks, Oregon (a town the PCT passes through) on the Oregon-Washington border called PCT Days. Some hikers make it their mission to make it to trail days (certainly not a prerequisite to wanting to hike the trail), and some even flip-flop or skip ahead to attend (this year a reported 1.1% of flip-floppers did so because of PCT Days).
I asked hikers whether they attended trail days and, for those who attended, whether they would recommend it to future PCT hikers
Did you attend PCT Days?
- 24.43% – Yes
- 75.57% – No

If you attended PCT Days, would you recommend it to future PCT hikers?
- 78.20% – Yes
- 21.80% – No

Before we move on to the next section, PCT Resupply, there’s one more piece of data I collected from hikers this year regarding their hikes. I asked hikers which animals they encountered over the course of their hikes. All anyone back home is going to care about is your bear or mountain lion encounter story, so let’s check out what your odds of delivering are.
Which ANIMALS did you see on the Pacific Crest Trail?
- 73% – Black bear
- 44% – Elk
- 35% – Fox
- 46% – Mountain goat
- 13% – Mountain lion (Cougar)
- 43% – Owl
- 92% – Rattlesnake
- 17% – Skunk
- 8% – Tortoise

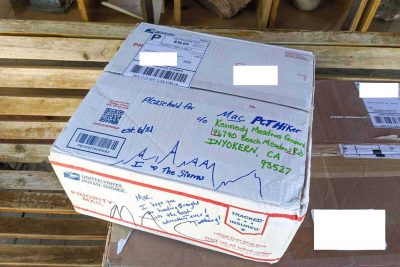
The PCT Resupply
The word “resupply” gets thrown around a lot in the context of thru-hiking. What is resupply? It’s basically getting yourself more food to power more hiking. Resupply on a Pacific Crest Trail has become a less scary thing over the years, but when and where hikers resupply is still a question that many find to be intimidating. Fortunately, we have many hundreds of experienced thru-hikers and resuppliers from this year who have shared their strategies with us.
Here’s this year’s RESUPPLY STRATEGY which includes the NUMBER OF RESUPPLIES, number of RESUPPLY BOXES sent, number of DAYS BETWEEN RESUPPLIES, hikers’ FAVORITE TOWNS, hikers’ LEAST FAVORITE TOWNS, and where hikers SUGGEST MAILING a resupply box.
THRU-1
27.63
The average number of resupplies over the entire trail
(σ = 5.52)
THRU-1
5.05
The average number of days between resupplies
(σ = 1.4)
THRU
4.08
The average number or pre-trail resupply boxes prepared
(σ = 5.7)
Resupply strategy used by thru-hikers
- 4.50% Mailed ALL resupplies
- 95.2% Mailed SOME resupplies
- 0.30% Mailed NO resupplies

Most hikers worry a lot about resupply, but you have to remember that you can mail yourself boxes from on the trail and you absolutely do not have to have ALL your resupply boxes prepared ahead of time. Many towns have large supermarkets (and post offices).
That said, it can be helpful to mail resupply boxes at some locations along the trail. This may be due to a limited selection of food, high prices, or perhaps something else (personal vendettas against shopkeepers?). Oftentimes, hikers find themselves having to hitchhike to town to resupply. In addition to asking hikers where they would DEFINITELY SUGGEST MAILING a resupply box, I asked where, if anywhere, they had DIFFICULTY HITCHHIKING.
What locations would you DEFINITELY SUGGEST MAILING a resupply box?
- Stehekin (Washington) 61.97%
- Crater Lake National Park (Oregon) 34.74%
- Sierra City (Northern California) 34.27%
- Stevens Pass/Skykomish (Washington) 33.80%
- White Pass (Washington) 32.63%
- Snoqualmie Pass (Washington) 32.16%
- Kennedy Meadows (Sierra) 26.53%
- Big Lake Youth Camp (Oregon) 26.06%
- Agua Dulce (Desert) 23.47%
- Warner Springs (Desert) 19.72%
- Seiad Valley (Northern California) 19.01%
- Timberline Lodge (Oregon) 16.67%
- Shelter Cover Resort (Oregon) 16.43%
- Belden (Northern California) 15.73%
- Kennedy Meadows North (Northern California) 15.49%
*Kennedy Meadows is where most hikers begin carrying bear canisters. The most popular bear canister from this year? (And every year.) The BV500. Personally, I’m a fan of the BV450, but more on that in the gear guide.
Where, if anywhere, did you have DIFFICULTY HITCHHIKING on the PCT?
- Bishop via Onion Valley/Independence (Sierra) – 6.83%
- Independence via Onion Valley (Sierra) – 4.28%
- Kennedy Meadows NORTH (Northern California) – 4.28%
- Bridgeport via Sonora Pass (Northern California) – 4.28%
- Julian via Scissors Crossing (Desert) – 4.15%
- Yosemite Valley (Sierra) – 4.15%
- Ashland (Oregon) – 3.75%
- Lake Isabella via Walker Pass (Desert) – 3.61%
- Lone Pine via Horseshoe Meadow (Sierra) – 3.61%
- Bend (Oregon) – 3.48%
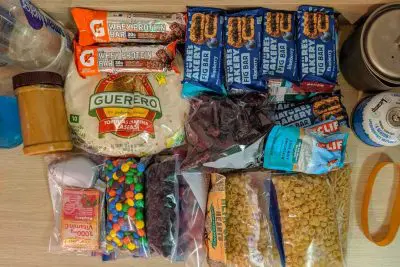
As part of my quest for better backpacking meals, I asked PCT hikers to share their favorite DEHYDRATED MEALS and BACKPACKING SNACKS. More on this to come in the PCT Resupply Guide.
FAVORITE BACKPACKING MEALS
FAVORITE BACKPACKING SNACKS
*These were also among the foods that hikers reported becoming the sickest of.
What CHANGES would you make to your resupply strategy if you were to go back and do it all over again?
- Send MORE VARIETY in boxes (20.62%)
- Send HEALTHIER FOOD in boxes (20.62%)
- Send FEWER resupply boxes* (19.01%)
- Mail boxes from ON TRAIL instead of ahead of time (18.07%)
- Send LESS FOOD in boxes (12.99%)
*The average number of boxes sent by hikers who said they would have liked to have sent FEWER boxes was 8.67.
THRU
14%
The number of thru-hikers who went stoveless for the entirety of their hikes.
If we take this to mean that eight is the maximum number of resupply boxes a thru-hiker would have liked to have sent this year, then according to our recommendation above (from the question, “Where would you definitely suggest mailing a resupply box?”), prospective thru-hikers should consider sending resupply boxes to the following locations:
- Stehekin (Washington) – 61.97%
- Crater Lake National Park (Oregon) – 34.74%
- Sierra City (Northern California) – 34.27%
- Stevens Pass (Washington) – 33.80%
- White Pass (Washington) – 32.63%
- Snoqualmie Pass (Washington) – 32.16%
- Kennedy Meadows (Desert) – 26.53%
- Big Lake Youth Camp (Oregon) – 26.06%
I asked WHERE HIKERS RESUPPLIED – not where they simply stopped/passed through, but where they actually purchased, picked up, were given, or otherwise came into a new stock of food for the next section of trail. For example, the trail passes through the middle of Agua Dulce; theoretically, all thru-hikers who completed the trail will have been there, but not all thru-hikers may have resupplied there. Make sense? I hope so because if you’re struggling with this, you’re going to have issues on the trail.
Locations are listed in geographical order from Mexico to Canada (that’s south to north in case you’re unsure) and, again, I used the following colors to indicate each resupply stop’s popularity: OVER 75%, 50-75%, 25-50%, LESS THAN 25%.
DESERT RESUPPLY
- Campo (6.34%)
- Mount Laguna (33.80%)
- Julian (51.88%)
- Warner Springs (76.76%)
- Paradise Cafe (6.81%)
- Anza (0.47%)
- Idyllwild (87.32%)
- Cabazon (20.66%)
- Big Bear City (32.16%)
- Big Bear Lake (64.55%)
- Wrightwood (86.62%)
- Acton (9.62%)
- Agua Dulce (74.88%)
- The Anderson’s/Casa de Luna (16.20%)
- Hikertown (23.24%)
- Wee Vill Market (24.65%)
- Tehachapi (92.25%)
- Mojave (3.05%)
- Onyx (0.94%)
- Lake Isabella (18.08%)
- Kernville (7.04%)
- Ridgecrest (36.85%)
SIERRA RESUPPLY
- Kennedy Meadows (67.84%)
- Grumpy Bears Retreat (33.33%)
- Lone Pine (40.38%)
- Independence (13.15%)
- Muir Trail Ranch (11.03%)
- Bishop (75.82%)
- Vermilion Valley Resort (34.04%)
- Red’s Meadow (6.57%)
- Mammoth Lakes (84.98%)
- Yosemite Valley (19.95%)
- Tuolumne Meadows (26.29%)
- Lee Vining (3.52%)
- Bridgeport (23.24%)
- Sonora Pass Resupply (0.94%)
- Kennedy Meadows North (62.44%)
- Markleeville (0.47%)
For more on the Kennedy Meadows to Vermilion Valley Resort resupply, find my detailed post here. If you’re interested in my PCT resupply for each section, check out the following posts:
- PCT Progress Report I: The Desert
- PCT Progress Report II: The Sierra
- PCT Progress Report III: NorCal
- PCT Progress Report IV: Oregon
- PCT Progress Report V: Washington
Find all PCT Resupply posts here.
NORTHERN CALIFORNIA RESUPPLY
- South Lake Tahoe (88.97%)
- Echo Lake (5.63%)
- Tahoe City (3.29%)
- Soda Springs (3.05%)
- Truckee (36.15%)
- Sierra City (74.41%)
- Quincy (27.00%)
- Chester (68.08%)
- Belden (50.70%)
- Drakesbad (8.45%)
- Old Station (23.94%)
- Burney (55.40%)
- Burney Falls (16.67%)
- Burney Mountain Guest Ranch (3.05%)
- Castella (11.97%)
- Dunsmuir (49.06%)
- Mount Shasta (35.68%)
- Etna (74.88%)
- Seiad Valley (70.66%)
OREGON RESUPPLY
- Callahan’s (7.75%)
- Ashland (88.73%)
- Fish Lake (12.44%)
- Lake of the Woods Resort (0.47%)
- Mazama Village Store (Crater Lake) (80.05%)
- Diamond Lake Resort (6.10%)
- Shelter Cove Resort (68.54%)
- Odell Lake Resort (1.41%)
- Elk Lake Resort (10.33%)
- Sisters (21.13%)
- Bend (43.19%)
- Big Lake Youth Camp (39.44%)
- Olallie Lake Resort (17.37%)
- Government Camp (8.92%)
- Timberline Lodge (42.49%)
- Sandy (0.09%)
- Cascade Locks (73.47%)
- Hood River (8.92%)
- Portland (18.31%)
WASHINGTON RESUPPLY
- Trout Lake (67.31%)
- White Pass (79.09%)
- Packwood (19.23%)
- Snoqualmie Pass (92.79%)
- Stevens Pass (48.80%)
- Skykomish (39.18%)
- Leavenworth (33.17%)
- Chelan (0.72%)
- Stehekin (86.30%)
- Mazama (9.38%)
- Winthrop (7.93%)
- Holden Village (5%)
- Seattle (6.97%)
Now we know the most popular stops for resupplying and for sending boxes, but what about hikers’ FAVORITE (and LEAST FAVORITE) resupply stops?
NOTE: When asking this question I specify “‘Favorite/Least Favorite’ means where you most/least enjoyed, not where had the best/worst resupply options (although these could be the same).”
FAVORITE RESUPPLY STOP
Bishop, CA
The Sierra (58.22%)
LEAST FAVORITE RESUPPLY STOP
Hikertown, CA
The Desert (24.65%)
FAVORITE RESUPPLY STOPS
- DESERT: Idyllwild (56.10%)
- SIERRA: Bishop (58.22%)
- NORCAL: Etna (26.29%)
- OREGON: Ashland (51.41%)
- WASHINGTON: Stehekin (28.17%)
RUNNERS-UP
- DESERT: Wrightwood (27.23%)
- SIERRA: Mammoth Lakes (39.44%)
- NORCAL: South Lake Tahoe (23.47%)
- OREGON: Cascade Locks (51.41%)
- WASHINGTON: Leavenworth (17.61%)
LEAST FAVORITE RESUPPLY STOPS
- DESERT: Hikertown (24.65%)
- SIERRA: Kennedy Meadows (11.50%)
- NORCAL: Belden (20.89%)
- OREGON: Crater Lake National Park (13.85%)
- WASHINGTON: Stehekin (10.09%)
RUNNERS-UP
- DESERT: Agua Dulce (12.68%)
- SIERRA: Grumpy Bears Retreat (8.69%)
- NORCAL: Sierra City (17.61%)
- OREGON: Timberline Lodge (3.52%)
- WASHINGTON: White Pass (5.16%)
Interesting to see that Stehekin took the #1 position for both favorite and least favorite resupply stop in Washington.
The PCT Gear
Perhaps the thing Pacific Crest Trail hikers spend the most time obsessing over before (and on) the trail, gear plays an essential role in a thru-hike. There is no magical gear combination that will guarantee you a successful thru-hike (if you know otherwise, please let me know), but there is certainly gear that can help (and hurt) the pursuit of this goal.
Each year I do a deep dive into the gear used by PCT hikers in my PCT Gear Guide, but I like to offer a preview of what’s to come in this first PCT Survey post.
Let’s take a look at what this year’s PCT Class had with them out on the trail.
THRU-1
17.78 lbs
Average pre-hike base weight (8.06 kg)
(σ = 7.60 lbs / 3.45 kg)
THRU-1
14.91 lbs
Average post-hike base weight (6.76 kg)
(σ = 6.21 lbs / 2.82 kg)
THRU-1
-2.87 lbs
Average total change in base weight (1.301 kg)
(σ = 6.21 lbs / 2.82 kg)
THRU
54.89 L
Average backpack size
THRU
16.9°F
Average sleeping bag rating (-8.38°C)
THRU-1
4.65
Average total number of shoes used
There are more detailed and more interesting breakdowns of this information on the way in this year’s PCT Gear Guide. For now, let’s take a peek at some of the gear thru-hikers were using on the trail this year. Here are the FAVORITE “Big 4” items: PACKS, SHELTERS, SLEEPING BAGS, and SLEEPING PADS (I know it’s the “Big 3”, but I include sleeping pads).
Again, there will be extensive breakdowns in the PCT Gear Guide.
FAVORITE BACKPACKS
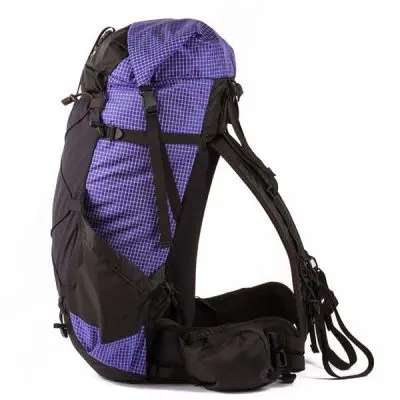
- ULA Circuit (Hiker Rating: 4.60/5)
- ULA Catalyst (4.55/5)
- Hyperlite Mountain Gear Windrider (4.50/5)
- Osprey Eja (4.40/5)
- Hyperlite Mountain Gear Southwest (4.32/5)
FAVORITE SHELTERS

- MSR Hubba NX 1 (Hiker Rating: 4.74/5)
- Big Agnes Copper Spur HV UL3 (4.68/5)
- Big Agnes Tiger Wall UL2 (4.64/5)
- Big Agnes Copper Spur HV UL2 (4.61/5)
- MSR Hubba Hubba NX 2 (4.56/5)
FAVORITE SLEEPING BAGS
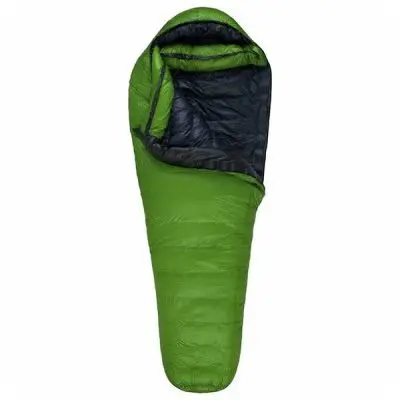
- Western Mountaineering Versalite (Hiker Rating: 4.94/5)
- Western Mountaineering UltraLite (4.87/5)
- Western Mountaineering Alpinlite (4.85/5)
- Enlightened Equipment Revelation 10 (4.53/5)
- REI Magma (4.44/5)
FAVORITE SLEEPING PADS
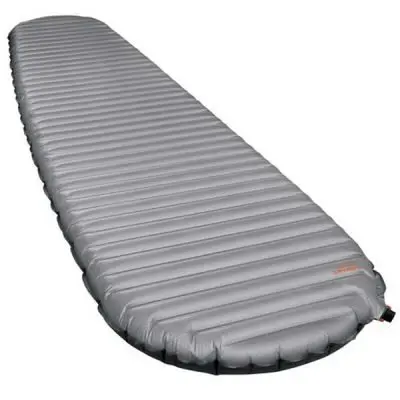
- Therm-a-Rest NeoAir XTherm (Hiker Rating: 4.82/5)
- Therm-a-Rest NeoAir XLite (4.402/5)
- Therm-a-Rest Z Lite Sol (4.400/5)
- Therm-a-Rest Z Lite Sol, Small (4.33/5)
- NEMO Tensor Insulated (4.25/5)
FAVORITE DOWN JACKETS

- Rab Microlight Alpine Jacket (Hiker Rating: 4.93/5)
- Enlightened Equipment Torrid Apex (4.88)
- Arc’teryx Cerium SL (4.79/5)
- Arc’teryx Cerium LT Down Hoodie (4.75/5)
- Feathered Friends Eos (4.73/5)
FAVORITE SHELLS

- Arc’teryx Beta SL Hybrid (Hiker Rating: 4.41/5)
- Marmot Minimalist (4.29/5)
- Montbell Versalite (4.15/5)
- Marmot Pre-Cip (4.07/5)
- Patagonia Torrentshell (4.07/5)
FAVORITE BEAR CANISTERS
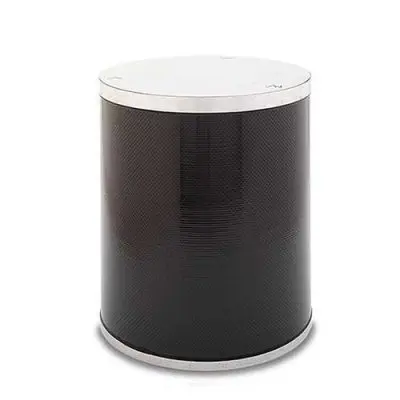
- Bearikade Weekender (Hiker Rating: 4.84/5)
- Bearikade Expedition (4.64/5)
- BV500 (4.08/5)
- Garcia Model 812 Backpackers’ Cache (3.74/5)
- BV450 (3.66/5)
FAVORITE WATER FILTERS
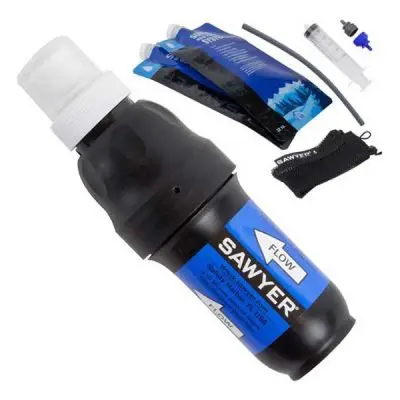
- Sawyer Squeeze (Hiker Rating: 4.55/5)
- Aquamira (4.42/5)
- Katadyn BeFree (4.13/5)
- Sawyer Micro (3.73/5)
- Sawyer Mini (3.53/5)
FAVORITE STOVES

- SOTO Windmaster (Hiker Rating: 4.94/5)
- MSR PocketRocket Deluxe (4.77/5)
- JetBoil MiniMo (4.63/5)
- Jetboil Flash (4.62/5)
- MSR PocketRocket 2 (4.57/5)
This is just the tip of the proverbial thru-hiking iceberg in the gear department. As mentioned (multiple times) above, I will soon be publishing a detailed breakdown of the PCT Class of 2019’s gear. This will include shoes, snow gear, luxury items, what hikers didn’t like about their gear, what gear decisions (might have) helped hikers to a successful thru-hike, and how hikers would change/adapt their gear for a future hike.
Here’s a preview of what this year’s class had to say about gear:
- It’s very cold and rainy in Oregon/Washington by late September onward. Be ready. I was very happy to have a new rain jacket (that didn’t wet out) and a synthetic puffy.
- Get a good shelter and sleeping bag it is worth the money – would recommend a pillow as well.
- Huge fan of Osprey standing behind their gear with their unrivaled guarantee. Salomon customer service let me down. Lined Wrightsocks avoid blisters. Not so easy to find alcohol for my stove.
- I based my main gear choices off of this guide and was 100% happy with everything.
- Should have researched pack size and sleeping temperatures more before the trail. First pack too small and first sleeping bag not warm enough.
- Do not ask the PCT Facebook Page anything about gear.
For more on gear, check out the Ultimate Pacific Crest Trail Packing List.
Phones on the trail are a fact of life. They are hikers’ cameras, GPS devices, televisions, music players, town-researching devices, and (sometimes) SOS devices. There are a number of APPS commonly used by Pacific Crest Trail hikers – and even one designed specifically for the PCT (that you should most certainly invest in). here are the apps I also asked hikers about the APPS they used on the PCT and the TYPE OF PHONE they used on the trail. The responses were:
WHAT APPS DID YOU USE ON THE PCT?
- 93.01% FarOut Guides
- 11.02% PeakFinder (Android/iOS)
- 8.89% Gaia (Android/iOS)
- 2.25% Hikerbot
WHAT TYPE OF PHONE DID YOU USE ON THE PCT?
- 55% iOS (iPhone)
- 44.7% Android
- 1.7% Other/No phone
The PCT Hiker Health
Water treatment and hygiene is a big consideration for hikers (at least it should be, you filthy animal). That said, it’s typically something a thru-hiker will worry less about as the trail goes on.
Some hikers religiously filter all the water they drink – it doesn’t matter if it comes out of a hotel sink or a puddle with a cow pooping in it. Other hikers will “not filter in the Sierra”, “not filter above 10,000 ft / 3,048 m”, or “not filter running water” (this last one is absolutely not a good idea – running water can definitely get you sick).
Obviously, everyone wants to look cool in front of their friends by not filtering water, but there are risks to the badass thru-hiker lifestyle (and to drinking dirty, giardia-infested water). Here I ask hikers how often they treated water sources and whether they got get sick (defined as three or more days of digestive issues or diagnosed giardia)?
- 3.5% Always treated, got sick
- 57.2% Always treated, never got sick
- 2.7% Mostly treated, got sick
- 28.9% Mostly treated, never got sick
- 0.7% Sometimes treated, got sick
- 6.2% Sometimes treated, never got sick
- 0.1% Never treated, got sick
- 0.7% Never treated, never got sick

Looking at this another way, we can see:
- 60.7% of hikers always treated their water and 5.8% of these hikers got sick
- 31.6% of hikers mostly treated their water and 8.5% of these hikers got sick
- 6.90% of hikers sometimes treated their water and 9.8% of these hikers got sick
- 0.80% of hikers never treated their water and 16.7% of these hikers got sick
In total, a reported 7% of hikers came down with something akin to giardia, and less than 1% never filtered (those who don’t filter are typically quite staunch in their commitment to their strategy; read: don’t readily admit to becoming sick from not filtering).
The PCT Likes and Dislikes
This may come as a shock, but the Pacific Crest Trail is a long hike with a lot to see (mostly bears). Here is a look at the FAVORITE and LEAST FAVORITE SECTIONS of the trail.
What was your FAVORITE PCT section?
- Sierra
- Washington
- The Desert
- Oregon
- Northern California
Specifically, the FAVORITE sections were:
- 58.69% – Goat Rocks Wilderness (Washington)
- 47.18% – The John Muir Trail (The Sierra)
- 45.07% – Kings Canyon National Park (The Sierra)
- 37.09 – North Cascades National Park (Washington)
- 26.53% – Glacier Peak Wilderness (Washington)

What was your LEAST FAVORITE PCT section?
- Northern California
- Oregon
- The Desert
- Washington
- The Sierra
Specifically, the LEAST FAVORITE sections were:
- 46.01% – Southern Oregon
- 43.19% – Belden to Burney Falls (Northern California)
- 32.39% – The Aqueduct (The Desert)
- 30.05% – Mojave/Tehachapi to Walker Pass (The Desert)
- 16.67% – Southern Washington

Pacific Crest Trail Resources
The planning phase of a Pacific Crest Trail thru-hike can sometimes be just as long and intensive as the thru-hike itself (or sometimes even longer). To help hikers best invest their pre-hike planning time, I ask which PCT RESOURCES hikers found MOST and LEAST VALUABLE when planning their hikes.
Which resource(s) did you find MOST VALUABLE when planning your hike?
- 70.01% – Halfway Anywhere* 🙂
- 49.40% – YouTube
- 48.06% – Friends/Former thru-hikers
- 44.71% – PCTA.org (shout out to the PCTA for vastly improving the quality of the content on their site and climbing the rankings in the most valuable PCT resources).
- 41.37% – Hiker Blogs
Which resource(s) did you find LEAST VALUABLE when planning your hike?
- 63.19% – Advice from non-thru-hikers
- 43.64% – PCT Facebook Pages/Groups
- 43.37% – Retail store employees
- 7.63% – Blogs
- 6.02% – Books about the PCT
*It’s awesome to see that Halfway Anywhere is helping PCT hikers plan and execute their hikes (especially to see that people think this even after hiking the trail). THANK YOU, everyone, who supports the site and encourages me to keep doing what I’m doing; it was awesome meeting (some of) you on the trail this year!
The PCT Fear, Regrets, and Advice
When asked if hikers ever felt LEGITIMATELY AFRAID on the trail, this is what they had to report (more of this will be included in a future post, but for now, here are some that stood out):
- After Fuller Ridge, I got lost and fell about 15 feet (3 m) down a section. Kept going until I realized I was badly off-trail. I had to climb 150-200 feet (45-60 m) of a steep horizontal ridge to rejoin the trail.
- Camping up high in Goat Rocks during one of the worst lightning storms I’ve ever experienced.
- Crossing flooded rivers in the Sierra with inexperienced hikers.
- Guns – hearing shots fired/seeing people carry guns is very frightening and made me feel very unsafe.
- The lady who gave me a hitch into Wrightwood was drinking while driving and kept drifting into oncoming traffic.
- We camped beside a road near one of the water caches before Walker Pass and a carload of men stopped and approached our tents. They called us green loving hippies and discussed pissing on our tents but thankfully left.
Now for PCT thru-hiker wisdom. I asked hikers what they would have DONE DIFFERENTLY BEFORE THEIR HIKES if they were to do it all over again.
- 29.99% – Gotten lighter gear
- 26.77% – Saved more money beforehand
- 26.10% – Trained more
- 14.73% – Gone on more practice hikes
- 13.92% – Planned less
THRU
21.77 lbs
The average base weight of hikers who said they would have liked to have gotten lighter gear before starting their hikes (9.87 kg)
In addition to asking hikers what they would have done differently prior to their thru-hikes, I asked them what they wish they had DONE DIFFERENTLY DURING THEIR HIKES. Here are the top responses (regrets):
- 51.94% – Taken more photos of people
- 21.82% – Journaled more
- 20.08% – Taken fewer zero days
- 18.61% – Spent less time in town
- 16.20% – Slowed down more on their hikes
THRU-1
22.35
The average number of zero days taken by hikers who said they wish they had taken fewer over the course of the trail
I also asked this class what ADVICE FOR FUTURE PCT HIKERS they had. This will be thoroughly documented in the post PCT: Advice For The Future, but for now, here are some of my favorites:
- The people you join up with can make or break your hike. If you’re feeling like you’re not connecting with a certain group, don’t feel bad about going your own way.
- Instagram and YouTube are not real life. The PCT is a harsh mistress, you will be miserable more than you enjoy yourself, in pain more often than you are comfortable, sharing your idyllic “wilderness experience” with dozens of random strangers a day, some of whom will have personalities you may revile or be on the trail for reasons entirely at odds with your own. If you start a thru-hike because some “influencer” told you it’s the quick and easy path to spiritual enlightenment, “finding yourself,” or solving all your problems in life, you’re going to have a bad time.
- Be independent. We were shocked by how much hikers relied on Trail Angels and Facebook to get help with the smallest things. I think you will have a better trail experience if you solve your own problems, and prepare for extreme weather.
- Give yourself grace. Your hike will be different than you planned. Allow yourself flexibility. Enjoy every moment. Don’t compare your experiences to others’ from social media.
- Plan less. Pack minimal and light but dial in your gear. If you’re a veggie make sure you are dialed into calories and protein for energy. Maybe send a box or two from the trail. Spend less money. Enjoy your time. Don’t push yourself in the beginning and never push an injury. Take care of yourself. Embrace every high and low. Nothing will go as planned and that is OK. You’ll likely spend more than you expect if things like storms pop up. Go to the PCT with the mindset of you’re on an adventure…anything and everything can happen but embrace it all. It’ll change your life forever.
- DO NOT listen to the fearmongering! It happened so much in 2019 and it got old quickly. What people say about conditions is subjective, see it for yourself before you make decisions.
Changes for next year’s survey
Here are the changes that I’ve decided on for next year’s survey. If you have any suggestions, I would love to hear them – leave a comment below to let me know.
- ADD QUESTION: NOBO thru-hikers, what date did you reach Cascade Locks? (I meant to add this question this year, but I clearly failed here)
Pacific Crest Trail Survey Collection
I made some big changes to the survey this year which added a lot of hours to the time I spent working on this. A MASSIVE THANK YOU to Paulina Dao for helping me with the data this year and showing me that my Excel/Sheets skills leave much to be desired. Without her, there’s no way I would have been able to get this posted when I did. Check out her work at Little Grunts or Instagram (where you can also find more photos of yours truly).
Finally, another HUGE THANK YOU to all the hikers who completed this year’s survey, including (but not limited to): 173, (Third Time’s The) Charm, >1, 2 Pack, 2pak, 55 Squared, Achilles, Acorn, All-in[-one], Allday, Allstar, American Pie, ANDELE, Anita Trailname, Apogee, Archimedes, Archive, Audio, Baby Bear, Baby Step, Backsplash, Backtrack, Bad Cheese, Badlass, Baguette, Baloo, Bambi, BandAid, Bandit, Bart Simpson, Battle Plan, Beans, Bear Magnet, Bearrito, Beats, Beaver, Behemoth, Benji, Berry, Best Man, Best Western, Bidet Day, Big Cheese, Big Money, Bigfoot, Bingo Bango, Bird, Bird, Birthday Girl, Blazing Star/Spider Monkey, Blind Bear, Bling, Blink, Blitz, Blondie, Blood Orange, Blue, Blueberry, Bluebird, Bobby Ozone or Bobby O, Bonus, Booboo aka Mr. Fredricksen, Boomerang, Bootski, Botox, Brando Commando, Bright side, Brightside, Bubblewrap, Budget, Buffy the Mosquito Slayer, Bullet, Bunyan, Bypass, Call Me Daddy, Calzone, Camino Steve, Camp Mom, Captain, Captain Chongo, Captain Hook, Carjack, Carpe Diem, Casino, Caterpillar, Cave Man, CBS, Cha Cha, Chainsaw, Chance, Chance Card, Change, Chaps, Chatty, Cheeks, Cheer, Cheery, Cheeseburger, Cheesegrater, Cheesus, Cheez it, Chef, Chickadee, Chickadee!, Chief Lizard, Chilly Bin, Chipmunk, Chocolate, Christopher Robin, Chuckles, CIA, Cinnamon, Claire, Clams, Clippy Tips, Cloud, Cloud.Reader, Coach, Columbia, Comet, CoMOMdo, Compass, Cosmo the Super Alien, Cougar Bait, Cowbell, CPT Jack, Cranberry, Crane, Crater, Crazy Burrito, Cream Cheese, Creamer, Cricket, Crosscreek, Cruze Control, Cutie with the Bootie, Daddy, Daddy Guacamole, Danger, Danger Poles, Dash, Day Break, DELUXE, Diamond, Dictionary, Diddly, Diesel, Dip aka The Juicer, Dips, Dirt, Dirty Bear, Dirty Harry, Diva, Dizzy, Dogboye2, Doin’ Stuff, Donuts, Down The Road, Downhill, DR. DAD, Dr. Dre, Duchess, Duckie, Dutch, Dutch Oven, Eagle, Early bird, Eastwood, Easy, El Chapo, El Hefe, embers, Energizer, ET, Exos, Expendable, Fable, Falls, Famous, Fancy, Fancy Feast, Farmer’s Market, Fast times, Fastrak, Fat Crank, Faucet, Fiddlehead, Field Trip, Finder, Finders Keepers, FireBall, Fireballz, Firekeeper, Flairhair, Flamethrower, Flapjack, Flower, Foot Juice, Footloose, Footprint, For Free, Forage, Foxtail, Free Flow, Frenchie, Frodo, Frogger, Froggy, Fugitive, Fun Buns, Gandalf, Gaper, Gato, Gee Spice, Gentle Oak, German Jesus, Ghostie, Gigs, Gilligan, Gills, Gilly, Gimpy, Gipsy Rainbow, Giraffe, Glow in the Dark, Glowworm, GOAT, Golden, Goldfish, Goldilocks, Good Cop, Good Flow, Goose, Grandma, Granny Gear, Gram, Gravity, Gray, Green Light, GreenBean, Grinder, Grizz, Güdfind, Gulliver, Gumby, Guru, Gusher, Half baked, Hand Tan, Hang Time, Hank, Happy Feet, Hawkeye, Haze, Hazmat, Heads up, Helium, Herbal-Witch, High Feet, High Noon, Highfive, Highlander, Hikerbox, Homemade, Honey stick, Honeybunz, Honeypot, Hop Along, Horse, Hot box, Hot Hands, Hot Lips, Hotlips, Huckleberry, Hummingbird, Indy, Irish Exit!, Iron Lady, Jack & Jill, Jaws, Jinx, John Wayne, Johnny Depp, Juicy, Juicy Fruit, Jukebox, Jukeboxx, Jumper, Just Fred, Kabuice, Kai, Kermit, Kermit aka Mountain, Kicks, Killa Bee, Killjoy, Kinda Bird, King, Kingslayer, Kit Kat and Double Ds with Shepherd, Kitano, Kurious Traveler, Lancelot, Laser Wolf, Late Start, Lava, Lazy Bones, Leapfrog, Lemonade, Link, Lion, Little Legs, Lizard, Log, Logic, Long legs, Lucky, Lucy Longlegs, Lunar, Lupine, Lush, M, Macarena, Machine, Macon Tracks, Magellan, Magpie, Mama G/Silverback, Marmalade, Marmot, Mary Poppins, Massive Sack, Mastermind, Max, Mayhem, Medicine Man (aka Vetonthepath), Meep Money Maker, Morp, Meow Meow, Meta, Mild Sauce, Miles, Milk Man, Milkshake, Misfit, Mittens, Mockingbird, Mojo, Jalan Jalan, Yonder, Molasses, Monsoon, Mosey, Moss, Mountain Lion, Mr. Clean, Mr. Flower, Mr. Fox, Mr. Peanut Butter, Mrs. Dash, Mudslide, Mulan, Mushka, MVP, Mylar, Mystery Powder, Nails, Napz, Nat Geo, Navi, Neon, Nest, New Girl, Nibbler, Ninja, Ninja Turtle, No point, No Worries, Nomadic Bear, NoNo, Noodles, Noods, North Pole, Northkountry, Nose Bleed, Not A Minor, Numbers, Oatmeal, Oberon, Ocean, Odo, Oh Lordie, Oily boy, Olaf, Old Bigfoot, One minute, One Step at a Time, Ooh BABY!, Oracle, Orange Crush, Oreo, Otter, P.E., Pace Maker, Pacific Rim, Pacman, Pain Cave, Pancake, Papa, Papacorn, Pastama, Patches, Patience, Pavlov, Pay It Forward, Pecos, Pep talk, Picasso, Pig Pen, Pigeon, Pilgrim, Pipe Dream, Pippi Long Legs, Pirate, Pit Stop, Pitstop, PJ (Pantsless Jim), Pocahontas, Pocket, Polar Bear, Pole, Poppins, Postmaster, Potato Rocket, Pothole, Princess Cowboy, Princess Leopard, Princess Polly, Professor, Prom King, Prometheus, Protector, Pumper, Pusher, R2, Rabbit, Ragdoll, Raider, Rainbow, Rainbow Brite, Raincloud, Ratatouille, Ravenous, Recharge, Red Jesus, Red Rooster, Red Vine, Reject, Rene, Rev, Reverend, Rhabdo, Ribbit, Ricky/Bobby, Ritual, RiverWulf, Roadrunner, Robin Hood, Rocket, Rocketman, Rocksie, Rooster, Rootbeer Float, Rug, Rusty Mama, Sad Spot, Safe, Saffron, Sage, Sailor, Saint Nik, Salsa, Sam-I-Am, Saucy Minx, Saunter, Savage Beast, Sayitagain, Scarecrow, Scout, Scribe, Season Pass, Shackles, Shadow, Shady, Shellac, Shepherd, Sherlock, Sherpa, Shine, Shoey, Shoobie, Shortstack, Shuffles, sia, Side Trip / Metric, Sideways, Siesta, Silent Bomb, Silver, SIMBA, Sir Puns-a-lot, Siren, Skeeter, Skipper, Skittles, Skunk, Sky Rider, Skypilot, Slide, Slime Mold, Slipy, Slow Burn, Smoothie, Snacks, Sneaky Steve, Snickers, Snoop, Snots, Snow Leopard, Sochi, Socks, Sodee, Solar, Soloette, Sombrero, Songbird, Sonic Supernova, SOODE, SOS, Sound Effect, Sour Patch, Space Race, Spamalicious, Spamcake, Spartan, Speedberry, Speedy Gonzalez, Spice, Splat, Sponge, Spook, Sprinkles, Sprout, Sprout, Sputnik, Squirrel, Squirt, Squirtle, Stacks, Stardust, Starshine, Stats, Steady, Steely Dan, Steve The Unicorn, Stevie G. Wonder, Stickers, Sticks, Stinkycheez, Store Brand, Storytime, Stresslevel, Stretch Armstrong, Stuck Foot, Sturgeon, Sugar Rush, Sunflower, Sunny, Sunny, Sunrise, Sunshine, Sunshine Bandit, Superman, Surefoot, Surge, Swedee, Swiss Bitch, Switch, Tail Light, TaZz, Teatime, Teflon, The Director, The John half of Papa John aka Shadow, The Mule, The Real Slim Shaylee, Thirty-Five, Thor, Thunder, Tie Dye, Tiger Hunter, Tight Buns, Tilly, Tinkerbell, Toatmeal, Tomahawk, Toots, Tootsie, Topo, Torso Boy, Tortuga, Tour guide, Toyota, Trademark, Trail Bait, TRAIN WRECK, Tranquilizer, Trash Panda, Trashalope, TrashCan, Trauma Shears, Trees, Trigger, Tripod, Trooper, Trouble, True Blue, Tsunami, Tumbler, Tumbleweed, Tuna Butter, Turtle, Tweek, Twistoff, Two Pair, Two Shoes, TwoPin, Uncle Buck, Üncle Nütsac, Uncle Sam, Uno Socko, Valley Girl, VFat, Views, Viking, Vitamin, Vortex, Vulture, Walgreens, Wallaby, Waters, Waypoint, Wayward, Web MD, Wheelz, Whip It!, Whiskey, White Walker, Whitney, Whole Roll, Wifeless, Wishful Thinking, Woodpecker, Woody, Wow, Xena, Yeti, Yoda, Ziplock, and Zombie
It takes a long time to put this together each year and I would love your feedback. Please COMMENT BELOW or get in touch to tell me what you think about this year’s survey or what you think will improve future surveys!
Affiliate Disclosure: This page may contain affiliate links, which means I may receive small commissions for purchases made via these links at no additional cost to you. This helps to pay the bills and keep the site up and running. Thank you for your support!