The Pacific Crest Trail Hiker Survey (2020)
In the second installment of the 2020 Pacific Crest Trail Hiker Survey, we’ll take a look at the hikers who were actually on the trail this year. Normally, this information is covered in the initial survey publication, but because of many hikers choosing to cancel their hikes due to COVID-19, I first published this year’s NOGO data.
The PCT Survey is now in its eighth year and I would like to extend a huge THANK YOU to everyone who took the time to participate – even if especially if you canceled your hike.
The PCT Survey is meant to be a useful resource to (actually) help those of you interested in hiking the Pacific Crest Trail figure out how the hell to approach such a monstrous journey. Every year, I try to improve the data collected and fine-tune the presentation to best help hikers. I would love to hear what you think in the comments below.
NOTE: The data is not going to be 100% guaranteed accurate – especially in a year like 2020. Despite my best efforts, there’s nothing scientific about the data collection or presentation. Remember, I’m just a random guy on the internet trying to help PCT hikers; take it easy.
Congratulations on arriving at a spot in the PCT Survey that most readers have probably skipped. Here are the results of Halfway Anywhere’s 2020 Pacific Crest Trail Hiker Survey!

Notes on the data
- This year we had 460 completed surveys – a 45% decrease vs. last year.
- Some responses have been sorted and colored to present the data in a friendlier manner (e.g. northbound vs. southbound responses).
- Not all PCT hikers meticulously document the stats of their thru-hike (yes, I’m weird). Therefore, the data is not going to be 100% accurate.
- I refer to survey respondents collectively as this year’s “class“. Remember, this is a sample and not a comprehensive survey of every single PCT hiker who intended to hike or who did hike the PCT this year.
- If they don’t currently recall anything more than math-exam anxiety, it’s suggested you familiarize yourself with the words average, median (M), and standard deviation (σ).
- For stats requiring the length of the PCT for a calculation (e.g. average mileage per day over the course of the trail), I use 2,660 mi / 4,280 km.
- I will be releasing more detailed posts focused on PCT Hikers Who Hiked vs. Those Who Canceled, PCT Gear, PCT Resupply, PCT Demographics, PCT Horror Stories, and PCT Advice in the coming weeks. If you would like to be notified of new surveys, click here.
LABELS differentiating hiker segments:
- NOGO: Hikers who intended on hiking the PCT in 2020 but who canceled their hikes
- THRU: Thru-hikers (all)
- THRU-0: Thru-hikers who did NOT complete the PCT
- THRU-1: Thru-hikers who completed the entire PCT
- NOBO: Northbound thru-hikers (all)
- NOBO-0: Northbound thru-hikers who did NOT complete the PCT
- NOBO-1: Northbound thru-hikers who completed the PCT
- SOBO: Southbound thru-hikers (all)
- SOBO-0: Southbound thru-hikers who did NOT complete the PCT
- SOBO-1: Southbound thru-hikers who completed the PCT
If NO LABEL has been appended to a data point, then I used all data collected.
COVID-19 Impacts
Let me start by repeating that I advised hikers in two separate posts (one and two) not to hike the PCT this year. Back in March, stay-at-home orders were issued in California, Oregon, and Washington, and we still had no idea where the pandemic was headed. The PCTA advised hikers to cancel their hikes and Disneyland shut down.
According to the survey, the majority of hikers made the difficult decision to cancel or postpone their hikes, while others chose to hike anyway.
The following is a breakdown of decisions hikers made this year in response to COVID-19.
How did COVID-19 affect your hike?
- 64.3% Canceled hike
- 15.2% Did not change anything
- 9.6% Delayed starting
- 5.6% Ended early
- 2.7% Started earlier
- 1.3% Delayed starting and also ended early
- 0.9% Got off trail but returned later
- 0.2% Switched direction hiked

Demographics
In this section, we examine the data collected from this year’s class who actually started the trail. If you’re interested in the overall picture of the (expected) PCT Class of 2020 (including NOGO), then check out Part 1 of the survey. I’ll be following up on this post (the one you’re reading now) with a comparison of hikers who canceled their hikes and those who chose to hike the trail.
Here are this year’s on-trail demographics.
PCT Hiker Gender
- 58.3% Male
- 39.8% Female
- 0.9% Genderqueer
- 0.9% Non-Binary

PCT Hiker Age
- 1.85% < 20
- 13.89% 20-24
- 27.78% 25-29
- 16.67% 30-34
- 13.89% 35-39
- 8.33% 40-49
- 12.96% 50-59
- 4.63% 60-69
- 0% >70
Average age: 35
Median age: 31
σ: 12

PCT Hiker Race
- 88.8% White
- 3.7% Asian
- 2.8% 2+ Races
- 2.8% Hispanic or Latino
- 0.9% Native Hawaiian or Other Pacific Islander
- 0.9% Decline to answer

PCT Hiker Education
- 39.6% Bachelor’s degree
- 17% Some college (no degree)
- 10.4% High school or equivalent
- 8.5% Associate Degree
- 5.7% Master’s degree
- 5.7% MBA
- 4.7% MD
- 4.7% PhD
- 1.9% JD
- 1.9% 12th grade or less

Where Hikers Are From
Every year, people come from all over the country and the world to hike the PCT. Here’s a look at where hikers on the trail this year were from.
- Australia, Belgium, Canada, Denmark, Finland, France, Germany, Japan, Luxembourg, New Zealand, Norway, Sweden, Switzerland, Taiwan, United Kingdom, United States (16 TOTAL)
A look at PCT hiker distribution across the world.

A closer look at where hikers come from across the Atlantic in Europe.

PCT Hiker US States & Territories
- AK, AZ, CA, CO, DC, FL, GA, HI, ID, IL, IN, MA, ME, MI, MN, NC, NH, NJ, NV, NY, OH, OR, PA, TX, VA, WA, WI (27 TOTAL)

MOST-REPRESENTED COUNTRIES
- USA – 80.4%
- Switzerland – 4.9%
- Germany – 3.9%
- The United Kingdom – 1%
- Canada – 1%
MOST-REPRESENTED US STATES
- California – 33.6%
- Washington – 13.6%
- Oregon – 12.7%
- Texas – 4.5%
- PA/MI/NV – 2.7%
Hiker Jobs & Working Conditions
How are you able to take so much time off to hike for five months across the United States? Probably a question that anyone planning a Pacific Crest Trail hike has been asked at some point or another.
This year, I asked hikers what they do for work (when they’re not being incredible hiking machines) and how they were able to take time off to hike the PCT.
Hiker Jobs
This year, hikers reported 68 different professions. The most common of which were:
- 9.2% Teacher
- 7.9% Engineer
- 6.6% Government
- 6.6% Registered Nurse
- 6.6% Retail
- 5.3% IT
- 5.3% Seasonal Work
- 5.3% Project Manager
That said, 13.5% (larger than any single profession) reported being retired. More on this in the next section.

Hiker Working Conditions
So how was this year’s class able to (or how would they have been able to) take all that time off and hike the PCT?
- 19.4% Between jobs
- 18.7% Unemployed
- 14.2% Retired
- 11.9% Flexible work conditions
- 11.2% Unpaid time off
- 5.2% Student
- 5.2% Negotiated into employment
- 3.7% Sabbatical
- 3.7% Seasonal Worker
- 3.7% Quit job
- 3% Gap year

I’ve realized that there exists some ambiguity regarding the choices of “between jobs” and “unemployed” as they are essentially the same thing. Next year, I may qualify “between jobs” to mean that you have a job already lined up for when you complete the PCT.
I will also try to make sure that the “quit job” option is properly added to each of these options.
Hiker Experience
Many of the survey respondents this year didn’t hike the PCT, but that doesn’t mean they weren’t planning their hikes for some time before COVID-19 shut the world down.
Here’s a look at what the 2020 class looked like during their “Planning a PCT Hike” phase. This section examines first-time hikers, hiker experience level, and other trails hiked.
First long-distance hike?
Instead of asking respondents whether this would be/was their first long-distance hike, I asked the distance of their longest hike to date (pre-PCT) – more on the specifics of this below. I decided to use 100 mi / 160 km as the cutoff for being considered to have completed a long-distance hike (sorry, Wonderland Trail hikers). If you want to yell at me for the arbitrary number I chose here (or suggest a better one), feel free to yell at me in the comments below.
First Time Hikers
- 57.5% Yes
- 42.5% No
Average longest trail hiked: 322
Median: 70

Hiker Experience Level
In addition to asking the longest trail completed by hikers pre-PCT, I ask respondents to evaluate their level of backpacking experience on a scale of 1 to 10.
- Average experience: 5.47
- Median experience: 5
- σ: 2.75
THRU-1: 5.25 (σ = 2.83)
THRU-0: 5.14 (σ = 2.65)

Previous Trails Hiked
The trails most commonly hiked by those with experience were:
- 7.56% PCT Section Hike
- 7.56% Appalachian Trail
- 5.88% John Muir Trail
- 5.88% Appalachian Trail Section Hike
- 4.2% Camino de Santiago
- 2.52% Tahoe Rim Trail
- 1.68% Colorado Trail
- 1.68% Kungsleden
- 1.68% Long Trail
- 0.84% Arizona Trail
- 0.84% Continental Divide Trail
- 0.84% Arizona Trail
- 0.84% Sierra High Route
- 4.20% Other trail

The most common trail this year’s Pacific Crest Trail Class had experience with was (once again) the Appalachian Trail.
Pre-hike Training
Next, we’ll look at whether this year’s class trained in preparation for their thru-hikes, what they did to train, and how they rated their fitness (pre-PCT).
Did you train before your hike?
- 65% Yes
- 35% No

What did you do to train?
- 45.28% Day Hikes
- 24.53% Running
- 19.5% Multi-day hikes
- 16.35% Weight Training
- 11.32% Step Machine
- 6.92% Other
“Other” mostly consisted of “walking” and/or some sort of bicycle riding.

Pre-trail Fitness Level
I asked hikers to rate their level of fitness (on a scale of 0 to 10) before beginning the trail.
Average fitness: 5.99
Median fitness: 6
σ: 1.71
THRU-1: 6.09 (σ = 1.81)
THRU-0: 6.06 (σ = 1.66)

Money Spent on Hike
The question of how much money is required for a thru-hike is one that gets asked by a lot of would-be PCT thru-hikers each year. Sure, I may have written a post on the subject, but the aggregate (albeit very much estimated) data from this year’s class will probably give us a better picture.
THRU-1
$8,059
The average amount spent on the entirety of a thru-hike
M = $7,100 | σ = $3,584
THRU-1
$58.79
The average amount spent per day on a thru-hike
M = $55.06 | σ = $27.47
THRU-1
$1,490
The average amount spent on gear before starting
M = $1,200 | σ = $1,406

Average spend: $1,613.90
Median spend: $1,500
σ: 1,231.28

Average spend: $8,059.09
Median spend: $7,100
σ: 3,584
Hiking Partners & Alone Time
Beginning a thru-hike on your own can sound scary and intimidating, but it turns out the majority of thru-hikers (and hikers in general) began their hikes alone. Here, we’ll look at who hikers began with, how much time they spent hiking and camping alone, whether they stayed with their hiking partner(s), hiker relationships,
Did you begin your hike alone?
- 67.7% Yes
- 15.2% Began with a partner or spouse
- 12% Began with a friend
- 5.1% Arranged to start with other hikers (whom they had not met before beginning the PCT)
Of this year’s first-time thru-hikers, 64.5% began their hikes alone.

What percentage of the time did you spend HIKING alone?
- 17.65% – < 10% of the time
- 4.41% – 10-25% of the time
- 7.35% – 25-50% of the time
- 20.59% – 50-75% of the time
- 33.82% – 75-90% of the time
- 16.18% – > 90% of the time
62% – Average amount of time thru-hikers, spent hiking alone (σ = 33.56)

Hiking alone here measures the amount of time that hikers weren’t physically walking with someone down the trail – not necessarily that they weren’t hiking with others over the course of the day.
What percentage of the time did you CAMP alone?
- 20.59% – 0% of the time
- 22.06% – 1-5% of the time
- 8.82% – 6-10% of the time
- 10.29% – 11-20% of the time
- 4.41% – 21-30% of the time
- 10.29% – 31-50% of the time
- 11.76% – 51-75% of the time
- 7.35% – 76-90% of the time
- 4.41% – > 90% of the time

28% – Average percentage of nights thru-hikers, spent camping alone (σ = 32.23). When we look at thru-hikers who finished, this translates to an average of 39 nights spent camping alone.
Sticking With Hiking Partner(s)
Beginning a hike with someone else is one thing, but finishing a hike with someone else is entirely different. Here’s how things worked out for everyone who began their hikes with another person.
If you began your hike with someone else, did you remain with them for the entirety of the trail?
- 65.2% Yes
- 13% No, we decided it wasn’t for the best
- 8.7% No, this was never the plan
- 8.7% Yes, for the most part
- 4.3% No, we were a couple and we’ve now broken up

Size of Hiking Group
This year, I asked hikers what the largest group was that they found themselves hiking with on a consistent basis. Some hikers refer to this as a “tramily“. This word makes me cringe. I’ll leave it at that.
Average group size: 4.6
Median size: 4
σ: 3.8

When you began the trail, were you in a relationship?
- 49.1% Yes, and I am still with the same person
- 40.3% No, and I am still single
- 3.8% No, but now I am in a relationship with someone I met on the PCT
- 3.1% No, but now I am in a relationship with someone I met before the PCT
- 2.5% Yes, but I am now single
- 0.6% Yes, but now I am in (a different) relationship with someone I met on the PCT
- 0.6% Yes, but now I am in (a different) relationship with someone I met before the PCT

Permits & Starting Dates
There’s been a lot of confusion surrounding PCT permits in 2020. Here are a few facts.
- Permits issued by the PCTA were valid so long as you respected the normal permit rules and began your hike on your permit’s start date.
- From the PCTA: “Permits already issued remain valid as long as you are in compliance with the terms of the permit and all regulations and policies, including state and local stay-at-home orders.“
- California had a strict stay-at-home order in effect from March 19 until May 7.
- 80% of northbound thru-hikers began their hikes before May 7
Was it technically possible to hike the PCT legally this year? Yes.
Whether you believe people should have been thru-hiking at all this year is another matter. Are most of the people who thru-hiked this year good people? I’m sure they are (the ones I met and/or spoke to were incredibly pleasant). Are some of them scum? Most certainly. But this is to be expected every year. How can you spot the difference? Just look at the comments on this post or wherever it is you found the link to this post.
Now onto the data. Here we look at whether hikers received permits for the start date they wanted and what dates hikers began their hikes.
Did you receive a permit for the start day you wanted?
This information was also included in Part I of the 2020 PCT Survey, but it belongs here as well so excuse the duplicate information if you’ve been following along.
Permits for the PCT are (generally) issued in two phases and require that you be online at a designated time as hikers are randomly allowed to request permit start dates. I asked this year’s class whether they got a permit for the date they wanted and whether they were happy with their permit’s date.
- 64% Yes (received a permit for date requested)
- 13% No, but still happy with permit date
- 8.6% Yes, received a permit for +/- 5 days of requested date
- 5.3% Yes, received a permit for +/- 3 days of requested date
- 2.6% Yes, received a permit for +/- 1 day of requested date
- 6.5% No (not happy with permit date)

Hiker Start Dates
Every year hikers stress out about their start dates, and every couple of years the Pacific Crest Trail Association makes changes to the rules governing long-distance permits for the PCT. The PCTA has yet to issue any permits for 2021 as they did not issue any in October (as they would have in a non-pandemic year).
The question of start date is tricky because the “ideal start date” changes dramatically on the year and on how quickly each person hikes.
This year, the data is more obscure because of COVID and the smaller number of hikers on the trail. For a normal year, you need to remember that just 50 long-distance permits are issued for the US-Mexico Border per day and it can be safely assumed the entire month of April and the first half of May will fill up quickly. Again, conditions on the PCT are different every year and just because starting at a particular time went well for one year’s class, doesn’t necessarily mean that it will be the best idea for the next year’s.
- April 6 – NOBO Average start date
- April 5 – NOBO Average start date for hikers who said they were happy with their start date
- March 14 – NOBO Average start date for hikers who said they would have liked to begin their hikes later
- May 19 – NOBO Average start date for hikers who said they would have liked to begin their hikes earlier
- April 4 – NOBO-0 Average start date
- April 8 – NOBO-1 Average start date

Hiking Stats & Dates
The Pacific Crest Trail is generally considered to have five sections: the Desert, the Sierra, Northern California, Oregon, and Washington.
Kennedy Meadows is the Desert/Sierra division (despite the Sierra range technically beginning further south), and Echo Lake/South Lake Tahoe is commonly considered the Sierra/Northern California division (and yes, the Sierra technically continues north). Basically “the Sierra” section of the PCT can also be considered “the section of the PCT that is most commonly filled with snow for the largest number of hikers (i.e. northbound hikers)”.
In this section, we look at how long thru-hikers took for each section of the trail, a breakdown of hike lengths and averages, and a look at how many days hikers took off (zero/nearo days).
Length of Each Section
- 58 (NOBO-1) – Average days to complete the Desert
- 36 (NOBO-1) – Average days to complete the Sierra
- 25 (NOBO-1) – Average days to complete Northern California
- 22 (NOBO-1) – Average days to complete Oregon
- 26 (NOBO-1) – Average days to complete Washington
- 162 (NOBO-1) – Average days to complete the PCT

NOTE: For some reason, I asked hikers what date they reached Sierra City instead of South Lake Tahoe for the below stats. I am updating this in next year’s survey.
Unfortunately, I did not receive enough responses from southbound hikers to provide similar data for SOBO hikes.
Length of Thru-hikes
THRU-1
162
The average number of days of an entire thru-hike
(M = 162 | σ = 23.6)
THRU-1
140
The average number of days hiking (total minus zero days)
(M = 140 | σ = 22.1)
NOBO-1
9/17
The average finish date (17/9 for the rest of the world)
(M = 9/18 | σ = 19)
THRU-1
16.9 mi
The average daily mileage (29.1 km)
(σ = 2.8 mi / 4.5 km)
THRU-1
23.9 mi
The average daily mileage after removing zero days (38.5 km)
(σ = 7.2 mi / 11.6 km)
THRU-1
36.15 mi
The average longest day of hiking (58.18 km)
(M = 34 | σ = 8.1 mi / 13.04)
Zero and Nearo Days (i.e. days off)
THRU-1
22
The average number of zero days (days off from hiking)
(M = 20 | σ = 11.7)
THRU-1
14
The average number of nearo days (low mileage days)
(M = 14 | σ = 8.27)
THRU-1
5.1
The average longest consecutive number of zero days
(M = 4 | σ = 3.8)
Flip-flopping, Completion Rates, & Footpaths
If you’re new to thru-hiking, here’s a quick explanation of what flip-flopping means in the context of a thru-hike. Flip-flopping, or flipping, is when a hiker skips a section of trail with the intention of coming back to hike it later in the hike (the flop). This usually takes one of two forms.
One is a hiker skipping ahead, continuing to hike the same direction, and then returning to the point they originally departed the trail to hike the skipped section later (e.g. northbound jumps from CA/OR border to OR/WA border, then hikes north to Canada before returning to CA/OR border to hike north to OR/WA border).
It can also be when a hiker skips ahead and then hikes the skipped section in the opposite direction of their original hike before jumping back up to the point where they originally skipped to and continuing their hike in the original direction (e.g. northbound hiker jumps from CA/OR border to OR/WA border and then hikes south to CA/OR border before returning to OR/WA border to continue hiking north).
Some hikers get wild with their flip-flopping (I recommend avoiding it if possible) and there are now rules in place that invalidate PCT permits for the Sierra if hikers fail to hike this section continuously (hikers can still flip-flop and get local permits to legally hike the Sierra).
Sorry, this explanation was longer than expected and probably deserves to be its own post. Here is what flip-flopping on the PCT looked like in 2020.
Did you flip-flop?
THRU 24% Yes
THRU 76% No
NOBO 24% Yes
NOBO 76% No
SOBO 16.67% Yes
SOBO 83.33% No

Why did hikers flip-flop?
- 59.3% Snow
- 18.5% Fires
- 11.1% COVID-19
- 7.4% To meet/stay with a hiking partner
- 3.7% Personal/Logistical

Where did hikers flip from/to?


All hikers who flipped in the Desert (including those flipping from Kennedy Meadows) did so because of snow. There was even a death in the Desert on the PCT this year because of early-season snowy/icy conditions in Southern California.
Completion Rates
Most people who begin thru-hikes of the Pacific Crest Trail do so with the intention of completing the entirety of the hike. Unfortunately (or in some cases, fortunately), not everyone who sets out on this most epic adventure of border-to-border glory will complete the trail. In fact, I guarantee you that a large percentage of people expecting to hike the PCT next year (and every year), will fail to do so.
We’re going to look at completion rates, but we are doing so with a caveat. Since I distribute this survey myself, and because it is not required of PCT hikers, survey respondents are a self-selecting group who (likely) skew toward having completed the trail (with the exception of this year’s NOGO hikers). A hiker who quit during their first week of hiking back in March or April is probably paying much less attention and caring far less about a Pacific Crest Trail survey released in the fall.
THRU
56.3%
The percentage of thru-hikers who completed the PCT.
NOBO
59.3%
The percentage of northbound thru-hikers who completed the PCT.
SOBO
0%*
The percentage of southbound thru-hikers who completed the PCT.
*I only received survey responses this year from six southbound thru-hikers.
It may sound straightforward enough, “Did you complete the PCT? Yes or no?” – but what constitutes a completed thru-hike isn’t necessarily the same for everyone.
Some people insist you need to have unbroken steps between Mexico and Canada along the official Pacific Crest Trail to constitute a thru-hike while others may forgive skipping a road walk, hitchhiking around a fire closure, or taking some alternates (or shortcuts).
To get a better idea of how much of the trail this year’s finishers hiked, I asked about their footsteps between the terminuses.
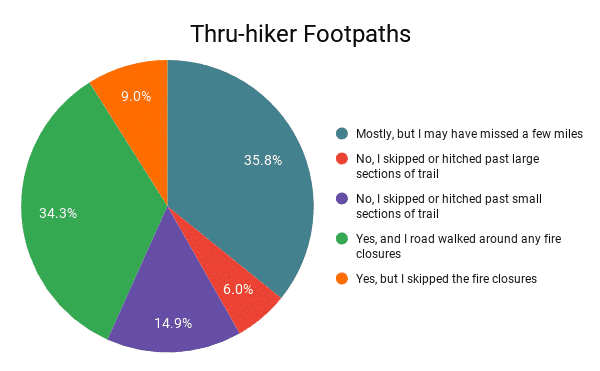
Did you hike a continuous and unbroken footpath between Mexico and Canada?
- 34.3% – Yes, and I road walked around any fire closures
- 9% Yes, but I skipped the fire closures
- 35.8% Mostly, but I may have missed a few miles
- 14.9% No, I skipped or hitched past small sections of trail
- 6% No, I skipped or hitched past large sections of trail
Alternate Routes
Despite the Pacific Crest Trail being a well-defined trail, there are a number of alternate trails (sometimes also known as “shortcuts”) hikers can take either in lieu of or in addition to the official PCT. I asked about these alternates to get an idea of what the most common PCT thru-hikes looked like. Alternates are listed in geographical order from south to north.
The following colors to indicate the popularity of each alternate (the percentage of hikers who reported taking each): OVER 75%, 50-75%, 25-50%, LESS THAN 25%.
DESERT ALTERNATES
- Spitler Trail (south of Idyllwild) – 13%
- South Ridge Trail (in and/or out of Idyllwild) – 2.6%
- Devil’s Slide Trail (in and/or out of Idyllwild) – 37.7%
- Deer Springs Trail (in and/or out of Idyllwild) – 10.4%
- Marion Mountain Trail – 1.3%
- Black Mountain Road (north of Idyllwild) – 23.4%
- Acorn Trail (in and/or out of Wrightwood) – 46.75%
- Buckhorn Camp Detour (north of Wrightwood) – 10.4%
- Upper Shake Campground – 3.9%
SIERRA ALTERNATES
- Trail Pass Trail – 9.5%
- Cottonwood Pass Trail – 16.2%
- Cottonwood Lakes/New Army Pass Trail – 1.4%
- Whitney Portal Trail – 21.6%
- Shepherd Pass Trail – 1.35%
- Kearsarge Pass Trail – 75.7%
- Sawmill Pass Trail – 2.7%
- Bishop Pass Trail – 2.7%
- Bear Ridge Trail (in and/or out of VVR) – 13.5%
- Goodale Pass Trail (in and/or out of VVR) – 9.5%
- Duck Pass Trail – 5.4%
- Mammoth Pass Trail – 44.6%
- Devils Postpile Trail – 29.7%
- John Muir Trail (between Red’s Meadow and Thousand Island Lake) – 13.5%
- Tuolumne Campground Trail – 12.2%
NORTHERN CALIFORNIA ALTERNATES
- Bucks Lake Alternate – 10.5%
- Castella Trail – 9%
OREGON ALTERNATES
- Callahan’s Side Trail – 29.2%
- Hyatt Lake Restaurant – 9.2%
- Mazama Campground (Crater Lake) – 53.9%
- Crater Lake Rim Alternate – 84.6%
- Shelter Cove Trail – 53.9%
- Elk Lake Resort Trail – 15.4%
- Big Lake Youth Camp Trail – 16.9%
- Eagle Creek Trail – 1.54%
WASHINGTON ALTERNATES
- Stevenson Roadwalk – 4.2%
- Old PCT Route past Old Snowy Mountain – 36.1%
- Miriam Clear Fork Fires Detour – 1.4%
- Goldmyer Hot Springs Alternate – 2.8%
- Milk Creek Trail – 1.4%
Not an alternate, but instead a side trip (an out-and-back from the PCT), hikers on the Pacific Crest trail pass just west of Mount Whitney in the Southern Sierra. The highest peak in the Continental United States at 14,505 ft / 4,421 m, it’s a tempting investment of time that most hikers take advantage of (the trip up from the PCT is easier, shorter, and less crowded than the trip up from the Whitney Portal Trailhead on the eastern side).
NOTE: A PCT permit allows you to day hike Mount Whitney from the western side (i.e. the PCT). You are not permitted to exit the Sierra via Whitney Portal or camp east of the Crabtree Ranger Station (yes, this includes Guitar Lake).
Did you summit Mount Whitney?
THRU 53% Yes
THRU 47% No
THRU-1 69% Yes
THRU-1 31% No

Why Hikers Didn’t Finish
In case you were left wondering what happened to the hikers who didn’t complete the PCT this year when we covered completion rates above, fear now. Here we’ll look at the specifics as to why hikers didn’t complete the PCT this year.
Why hikers didn’t complete the PCT this year
- 44.4% COVID-19
- 22.2% Fires
- 14.8% Injury
- 5.6% Personal
- 3.7% Snow
- 1.9% Work
- 1.9% Family
- 1.9% Defeated
- 1.9% Illness

Hike-ending injuries and where they occurred
Injury is oftentimes one of the biggest killers of a thru-hike (and is usually the largest in terms of things hikers have somewhat control over). This year I’ve broken down what kinds of injuries ended hikes and where hikers were injured.
Hike-ending injuries
- 28.6% Overuse injury (leg)
- 28.6% Overuse injury (foot)
- 14.3% Stress fracture (foot)
- 14.3% Hyperextended hip
- 14.3% Knee replacement damaged
Where injuries occurred
- 37.5% The Sierra
- 25% Northern California
- 25% Washington
- 12.5% Oregon

The number of miles completed by hikers who didn’t finish the PCT
- 21.8% – < 100 mi / 160 km
- 7.3% – 100 to 500 mi / 160 to 805 km
- 23.6% – 500 to 1,000 mi / 805 to 1,609 km
- 9.1% – 1000 to 1,500 mi / 1,609 to 2,414 km
- 9.1% – 1500 to 2,000 mi / 2,414 to 4,023 km
- 5.45% – > 2,000 mi / 4,023 km
Average: 639 mi / 1,028 km
Mean: 400
σ = 651 mi / 1,048 km

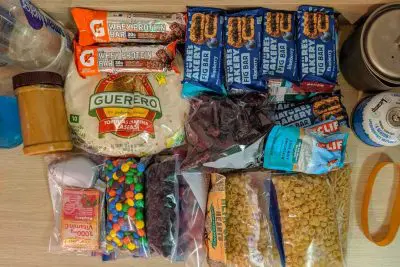
Resupply
The word “resupply” can be anxiety-inducing if you’re new to the idea of a thru-hike. What is resupply? Where does it come from? How much of it is there? How do you get it? Will it hurt?
Basically, resupply is getting yourself more food to power more hiking. Nothing that needs to be too scary or intimidating. Resupply on a Pacific Crest Trail has become less scary over the years, but when and where hikers resupply is still a question that many find overwhelming.
Here we have this year’s resupply stats, resupply strategy/boxes, resupply box suggestions, hitchhiking difficulties, where hikers resupplied, favorite and least favorite resupply stops, favorite meals and snacks, and resupply advice.
PCT Resupply Stats
THRU-1
27.32
The average number of resupplies over the entire trail
(M =29 | σ = 7.5)
THRU-1
6.4
The average number of days between resupplies
(M = 5.6 | σ = 2.2)
THRU
4.11
The average number or pre-trail resupply boxes prepared
(M = 1.5 | σ = 6.7)
Thru-hiker Resupply Strategy
- 7.4% Mailed ALL resupplies
- 17.6% Mailed MOST resupplies (> 50%)
- 58.8% Mailed SOME resupplies (10-50%)
- 11.8% Mailed A FEW resupplies (1-10%)
- 4.4% Mailed NO resupplies
Average boxes sent: 10.3
Median boxes sent: 8
σ: 7.9

Most hikers worry a lot about resupply, but you have to remember that you can mail yourself boxes from on the trail and you do not have to have ALL your resupply boxes prepared ahead of time. Many towns have large supermarkets (and post offices).
That said, it can be helpful (and oftentimes time-saving) to mail resupply boxes to stops on the trail. Hikes can choose this option because of a limited food selection, dietary restrictions, high prices, or even the owners of the local resupply establishment being assholes (I’m looking at you, Acton KOA).
Something else to take into account when thinking about resupply is the fact that many of the trail towns along the PCT are only accessible via car (or ludicrously long, dangerous, and ill-advised road walks). How do you get to these towns? You hitchhike, of course.
Here are the places hikers say they definitely recommend sending a resupply box and where they had difficulty hitchhiking to/from.
Definitely suggest mailing a box
- Stehekin (Washington) 75%
- Sierra City (Northern California) 39.7%
- Warner Springs (Desert) 35.3%
- White Pass (Washington) 33.8%
- Snoqualmie Pass (Washington) 33.8%
- Acton KOA (Desert) 32.4%
- Belden (Northern California) 30.9%
- Grumpy Bears Retreat* (Sierra) 26.8%
- Skykomish (Washington ) 25%
- Crater Lake National Park (Oregon) 25%
*Kennedy Meadows (Grumpy Bears Retreat) is where most hikers begin carrying bear canisters. The most popular bear canister from this year? (And every year.) The BV500. Personally, I’m a fan of the BV450, but more on that in the gear guide.
Difficult hitches
- Bishop via Onion Valley/Independence (Sierra) – 11.8%
- Big Bear Lake (Desert) – 11.8%
- Lone Pine via Horseshoe Meadow (Sierra) – 7.4%
Where Hikers Resupplied
I asked hikers to report on where they resupplied – not where they stopped/passed through, but where they actually purchased, picked up, were given, or otherwise came into a new stock of food. For example, the trail passes through the middle of Agua Dulce; theoretically, all thru-hikers who completed the trail will have been there, but not all thru-hikers resupplied there. Make sense? I hope so because if you’re struggling with this, you’re going to have issues on the trail.
Locations are listed in geographical order from Mexico to Canada (that’s south to north in case you’re unsure) and, again, I used the following colors to indicate each resupply stop’s popularity: OVER 75%, 50-75%, 25-50%, LESS THAN 25%.
DESERT RESUPPLY
- Campo (10.6%)
- Mount Laguna (40%)
- Julian (40%)
- Warner Springs (67.1%)*
- Paradise Cafe (15.3%)
- Idyllwild (80%)
- Cabazon (20%)
- Big Bear City (48.2%)
- Big Bear Lake (38.8%)
- Wrightwood (72.9%)
- Acton (65.9%)*
- Agua Dulce (16.5%)
- The Anderson’s/Casa de Luna (4.7%)
- Hikertown (14.1%)
- Wee Vill Market (42.4%)
- Tehachapi (78.8%)
- Mojave (9.4%)
- Lake Isabella (9.4%)
- Kernville (3.5%)
- Ridgecrest (44.7%)
SIERRA RESUPPLY
- Kennedy Meadows (33.3%)
- Grumpy Bears Retreat (59.5%)*
- Lone Pine via Horseshoe Meadow (17.9%)
- Bishop via Horseshoe Meadow (4.8%)
- Lone Pine via Kearsarge Pass/Onion Valley (10.7%)
- Independence via Kearsarge Pass/Onion Valley (13.15%)
- Bishop via Kearsarge Pass/Onion Valley (52.4%)
- Muir Trail Ranch (2.4%)
- Bishop via Bishop Pass/South Lake (2.4%)
- Vermilion Valley Resort (48.8%)
- Red’s Meadow (13.1%)
- Mammoth Lakes (66.7%)
- Tuolumne Meadows (6%)
- Yosemite Valley (8.3%)
- Lee Vining (9.5%)
- Bridgeport (9.5%)
- Kennedy Meadows North (77.4%)
- Markleeville (2.4%)
NORTHERN CALIFORNIA RESUPPLY
- South Lake Tahoe (83.1%)
- Stateline (2.8%)
- Echo Lake (8.5%)
- Soda Springs (4.2%)
- Truckee (23.9%)
- Sierra City (74.7%)*
- Quincy (26.8%)
- Chester (39.4%)
- Belden (57.8%)*
- Drakesbad Guest Ranch (5.6%)
- Old Station (33.8%)
- Burney (50.7%)
- Burney Falls (14.1%)
- Burney Mountain Guest Ranch (4.2%)
- Castella (9.9%)
- Dunsmuir (32.4%)
- Mount Shasta (49.3%)
- Etna (76.1%)
- Seiad Valley (62%)
OREGON RESUPPLY
- Callahan’s (21.1%)
- Ashland (68.4%)
- Fish Lake (19.7%)
- Lake of the Woods Resort (1.3%)
- Mazama Village Store (Crater Lake) (80.6%)*
- Diamond Lake Resort (5.3%)
- Shelter Cove Resort (84.2%)
- Odell Lake Resort (2.6%)
- Elk Lake Resort (13.2%)
- Sisters (35.5%)
- Bend (63.2%)
- Big Lake Youth Camp (1.3%)
- Olallie Lake Resort (25%)
- Government Camp (17.1%)
- Timberline Lodge (46.1%)
- Cascade Locks (76.3%)
- Hood River (7.9%)
- Portland (9.2%)
WASHINGTON RESUPPLY
- Trout Lake (55.6%)
- White Pass (71.6%)*
- Packwood (24.7%)
- Snoqualmie Pass (90.1%)*
- Stevens Pass (39.5%)
- Skykomish (43.2%)*
- Leavenworth (40.7%)
- Chelan (2.8%)
- Stehekin (77.8%)*
- Mazama (7.4%)
- Winthrop (13.9%)
- Rainy Pass (1.2%)
- Harts Pass (1.2%)
- Wenatchee (1.2%)
- Seattle (4.9%)
*Based on the information we have from hikers, ten is the maximum number of resupply boxes. The stops denoted above are the ten this year’s class has indicated they would have sent resupply boxes to.
Favorite & Least Favorite Resupply Stops
Now we know the most popular stops for resupplying and for sending boxes, but what about hikers’ favorite and least favorite resupply stops?
NOTE: When asking this question I specify “‘Favorite/Least Favorite’ means where you most/least enjoyed, not where had the best/worst resupply options (although these could be the same).”
FAVORITE RESUPPLY STOP
Bishop, CA
The Sierra (45.6%)
LEAST FAVORITE RESUPPLY STOP
Belden, CA
Northern California (29.4%)
FAVORITE RESUPPLY STOPS
- DESERT: Idyllwild (38.2%)
- SIERRA: Bishop (45.6%)
- NORCAL: Etna (25%)
- OREGON: Ashland (45.6%)
- WASHINGTON: Stehekin (27.9%)
RUNNERS-UP
- DESERT: Wrightwood (13.2%)
- SIERRA: Mammoth Lakes (19.1%)
- NORCAL: South Lake Tahoe (13.2%)
- OREGON: Bend (23.5%)
- WASHINGTON: Leavenworth (17.7%)
LEAST FAVORITE RESUPPLY STOPS
- DESERT: Acton KOA (19.1%)
- SIERRA: Grumpy Bears Retreat (10.3%)
- NORCAL: Belden (29.4%)
- OREGON: Crater Lake National Park (7.4%)
- WASHINGTON: Stehekin (11.8%)
RUNNERS-UP
- DESERT: Warner Springs (14.7%)
- SIERRA: Vermillion Valley Resort (7.4%)
- NORCAL: Seiad Valley (16.2%)
- OREGON: N/A
- WASHINGTON: White Pass (7.4%)
Favorite Meals & Snacks
As part of my quest for better backpacking meals, I asked PCT hikers to share their favorite sources of calories whilst on the trail. More on this to come in the PCT Resupply Guide.
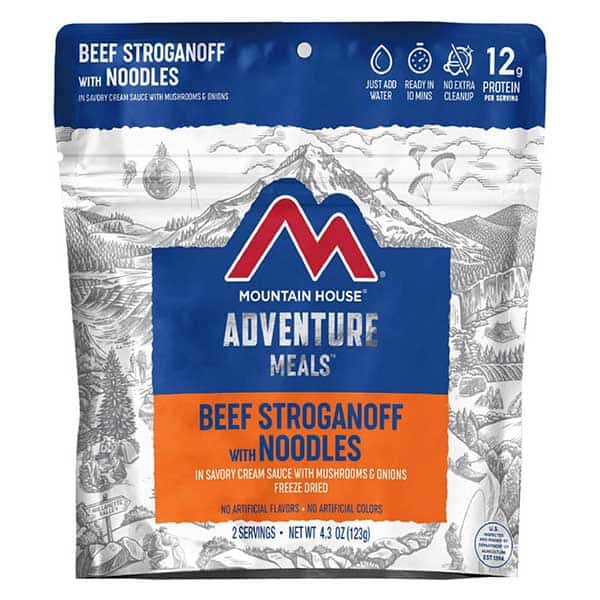
Favorite Backpacking Meals
Favorite Backpacking Snacks

Resupply Changes
Hindsight is 20/20 (unless you’re looking back through the darkness for that mountain lion you think might be following you). Here is what hikers said they would change about their resupply strategies if they had the chance to do it all over again. These don’t change much from year to year, so I would highly encourage you to heed this advice when considering your resupply options.
- Send FEWER resupply boxes* (26.5%)
- Send boxes from ON TRAIL instead of ahead of time (17.7%)
- Send HEALTHIER FOOD in boxes (17.7%)
- Send MORE VARIETY in boxes (13.2%)
- Send LESS FOOD in boxes (13.2%)
*The average number of boxes sent by hikers who said they would have liked to have sent FEWER boxes was 11.9. The average was 10.3
THRU
12.3%
The number of thru-hikers who went stoveless for the entirety of their hikes.
Find all PCT Resupply posts here.
Thru-hiking Gear
Maybe the thing Pacific Crest Trail hikers spend the most time obsessing over before (and on…and after) the trail is their gear. Gear choices play an essential role in a thru-hike, but there is no magical gear combination that will guarantee you a successful thru-hike (if you know otherwise, please let me know). That said, there is certainly gear that can help (and hurt) thru-hikers.
Each year I do a deep dive into the gear used by PCT hikers in my PCT Gear Guide, but I like to offer a preview of what’s to come in this PCT Survey post.
Let’s take a look at what this year’s PCT Class had with them out on the trail.
THRU-1
18.95 lbs
Average pre-hike base weight (8.595 kg)
(M = 18 lbs / 8.16 kg | σ = 6.7 lbs / 3.04 kg)
THRU-1
16.94 lbs
Average post-hike base weight (7.683 kg)
(M = 16 lbs / 7.26 kg | σ = 5.49 lbs / 2.49 kg)
THRU-1
-2.28 lbs
Average total change in base weight (1.034 kg)
(M = 1.5 lbs / 680 g)
THRU
54.1 L
Average backpack size
(M = 55)
THRU
17.8°F
Average sleeping bag rating (-7.89°C)
(M = 18°F / -7.78°C)
THRU-1
4.97
Average total number of shoes used
(M = 5)
There are more detailed and more interesting breakdowns of this information on the way in this year’s PCT Gear Guide. For now, let’s take a peek at some of the gear thru-hikers were using on the trail this year. Here are the favorite “Big 4” items: packs, shelters, sleeping bags, and sleeping pads (I know it’s the “Big 3”, but I include sleeping pads, get over it) along with the top insulated jackets and shells.
Again, there will be extensive breakdowns in the PCT Gear Guide.
Favorite PCT Backpacks
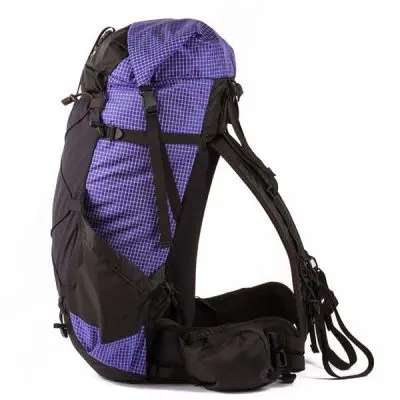
- ULA Circuit (Hiker Rating: 9.31/10)
- Gossamer Gear Mariposa (8.54/10)
- Hyperlite Mountain Gear Windrider (8.43/10)
- Osprey Eja (8.25/10)
- ULA Catalyst (8.17/10)
Favorite PCT Shelters

- Big Agnes Copper Spur HV UL3 (10/10)
- Big Agnes Fly Creek HV UL1 (9.67/10)
- Big Agnes Copper Spur HV UL1 (9.5/10)
- Tarptent Stratospire Li (9.4/10)
- Big Agnes Tiger Wall UL2 (9/10)
Favorite PCT Sleeping Bags
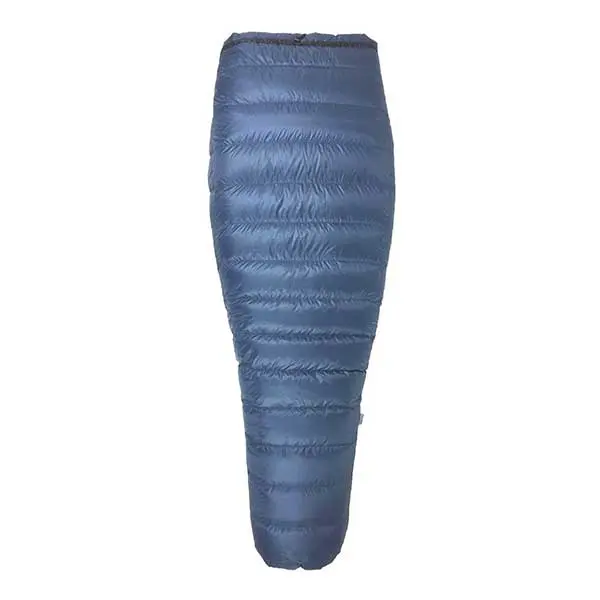
- Katabatic Flex (Hiker Rating: 9.56/10)
- Western Mountaineering Versalite (9.4/10)
- Mountain Hardwear Phantom (9.3/10)
- Western Mountaineering UltraLite (8.75/10)
- Enlightened Equipment Enigma (8.44/10)
Favorite PCT Sleeping Pads

- Sea to Summit UltraLight Insulated (Hiker Rating: 9.33/10)
- Therm-a-Rest NeoAir XLite – Women’s (8.77/10)
- Therm-a-Rest NeoAir XTherm (8.6/10)
- Therm-a-Rest NeoAir XLite, Short (8.6/10)
- NEMO Tensor Insulated (8.11/10)
Favorite PCT Insulated Jackets

- Mountain Hardwear Ghost Whisperer (Hiker Rating: 9.88/10)
- Patagonia Nano Puff (Hooded) (9.75/10)
- Enlightened Equipment Torrid Apex (9.64/10)
- Arc’teryx Cerium LT Down Hoodie (9.5/10)
- Mountain Hardwear Ghost Whisperer (Hooded) (9.25/10)
Favorite PCT Shells

- Patagonia Torrentshell (Hiker Rating: 9.43/10)
- Arc’teryx Zeta SL (9.33/10)
- The North Face Venture 2 (9.33/10)
- Arc’teryx Beta SL Hybrid (9/10)
- Marmot Pre-Cip Eco (8.83/10)
This is just the tip of the proverbial thru-hiking iceberg in the gear department. As mentioned above, I will soon be publishing a detailed breakdown of this year’s PCT gear. This will include snow gear, luxury items, what hikers didn’t like about their gear, what gear decisions (might have) helped hikers to a successful thru-hike, how hikers would change/adapt their gear for a future hike, and more.
If you would like to be notified when this post goes live, enter your email below:
For more on gear, check out the Ultimate Pacific Crest Trail Packing List.
Technology on Trail
Long gone are the days of PCT old when it was a trail sought out by only the most experienced backcountry orienteers; thanks to the magic of technology, any dodo can grab a phone and have a reasonably good chance of not killing themselves on the trail.
Phones are a fact of life on the trail, and if the sight of them in the wilderness distresses you, then you had best prepare yourself. Phones are hikers’ cameras, GPS devices, televisions, music players, town-researching devices, and (sometimes) SOS devices. There are a number of apps commonly used by Pacific Crest Trail hikers – and even one designed specifically for the PCT (that you should most certainly invest in).
Here are the apps and phones hikers were using out on the trail this year.
Which type of phone did you carry?
- 62.1% iPhone
- 37.9% Android

Which apps did you use?

Hiker Health & Filtering
Water treatment and hygiene is a big consideration for hikers (or it should be). That said, it’s typically something thru-hikers worry less about as the trail goes on (for extreme athletes, thru-hikers can be incredibly lazy).
Some hikers religiously filter all water that passes through their face hole – it doesn’t matter if it comes out of a hotel sink or a puddle with a cow pooping in it. Other hikers will “not filter in the Sierra”, “not filter above 10,000 ft / 3,048 m”, or “not filter running water” (this last one is not a good idea – running water can definitely get you sick).
Obviously, everyone wants to look cool in front of their friends by not filtering water (remind me why people think this is cool again?), but there are risks to the badass thru-hiker lifestyle (and to drinking dirty, giardia-infested water).
To find out how good a job everyone is doing filtering their water and sanitizing their hands after pooping (another way to get yourself sick), I ask hikers how often they treated water sources and whether they got get sick (defined as three or more days of digestive issues or diagnosed giardia).
- 1.3% Always treated, got sick
- 67.3% Always treated, never got sick
- 1.9% Usually treated, got sick
- 19.9% Usually treated, never got sick
- 0% Sometimes treated, got sick
- 8.3% Sometimes treated, never got sick
- 0.6% Never treated, got sick
- 0.6% Never treated, never got sick

Looking at this another way, we can see:
- 68.6% of hikers always treated their water and 1.9% of these hikers got sick
- 21.8% of hikers usually treated their water and 8.8% of these hikers got sick
- 8.3% of hikers sometimes treated their water and 0% of these hikers got sick
- 1.3% of hikers never treated their water and 50% of these hikers got sick
In total, a reported 3.8% of hikers came down with something akin to giardia, and 1.3% never filtered (those who don’t filter are typically quite staunch in their commitment to their strategy; read: don’t readily admit to becoming sick from not filtering).
Favorite/Least Favorite Sections
This may come as a shock, but the Pacific Crest Trail is a long hike with a lot to see (mostly bears). Here is a look at the favorite and least favorite sections of the trail.
Favorite PCT Section
- Sierra
- Washington
- The Desert
- Oregon
- Northern California
Favorite PCT Section (Specific)
- 63.2% – Goat Rocks Wilderness (Washington)
- 47.1% – Kings Canyon National Park (The Sierra)
- 44.1% – The John Muir Trail (The Sierra)
- 33.8% – North Cascades National Park (Washington)
- 23.5% – Three Sisters Wilderness (Oregon)

Least Favorite PCT Section
- Northern California
- Oregon
- The Desert
- Washington
- The Sierra
Least Favorite PCT Section (Specific)
- 58.8% – Southern Oregon
- 47.1% – Belden to Burney Falls (Northern California)
- 33.8% – Mojave/Tehachapi to Walker Pass (The Desert)
- 27.9% – The Aqueduct (The Desert)
- 19.1% – Southern Washington

Fear, Regrets, and Advice
When asked if hikers ever felt legitimately afraid on the trail, this is what they had to report (more of this will be included in a future post, but for now, here are some that stood out):
- After Sonora Pass, I encountered a thunderstorm at 9,000 ft / 2,743 m and had to scramble down the trail to lower elevation in order to get out of danger.
- Almost died on Forester Pass during a moderate rock slide. Took cover behind a large boulder and everything rolled over the top of me. Witnessed three potentially lethal rock slides this year.
- We got a hitch to Packwood from someone who, a few minutes into the drive, we realized was very clearly high on stimulants. Rambling manically, calling us rattlesnakes, driving with his knees…scary, but we made it.
- I had a Zpacks Duplex failure in a rainstorm outside of Mount Laguna. I tried to move to a more covered position but my tent was defective. I ended up getting soaked through my sleeping bag and hypothermia.
Now for PCT thru-hiker wisdom. I asked hikers what they would have done differently before their hikes if they were to do it all over again.
- 20.8% – Gotten lighter gear
- 17% – Saved more money beforehand
- 17% – Started earlier
- 15.7% – Trained more
- 11.3% – Had gear more dialed in
THRU
20.84 lbs
The average base weight of hikers who said they would have liked to have gotten lighter gear before starting their hikes (9.452 kg)
In addition to asking hikers what they would have done differently before their thru-hikes, I asked them what they wish they had done differently during their hikes. Here are the top responses (regrets):
- 34% – Taken more photos of people
- 15.1% – Slowed down
- 13.2% – Maintained a journal/blog
- 12% – Fewer zero days
- 8.8% – More on-trail zero days
THRU-1
25.63
The average number of zero days taken by hikers who said they wish they had taken fewer over the course of the trail
I also ask hikers what advice for future PCT hikers they have. This will be thoroughly documented in the upcoming post PCT: Advice For The Future, but for now, here is a sampling.
- Don’t join or pay attention to the PCT Facebook groups, they are garbage. Take any advice you get with a grain of salt, hikers can be idiots as well.
- Complaining does not make the hill end or the rain stop any sooner.
- Clear up your personal obligations before taking off. They have a way of following you to the trail and causing distractions. Don’t over plan. Just plan and start walking. You’ll figure it out.
- Have a good reason. Losing weight for my sister’s wedding wasn’t a very good reason and after the wedding, I wound up off the trail.
- Don’t stay committed to a trail family that has the wrong pace or agenda.
- Get your gear dialed in, get it as compact and light as you can. Test it all out ahead of time to make sure it works and you like it.
Animal Sightings
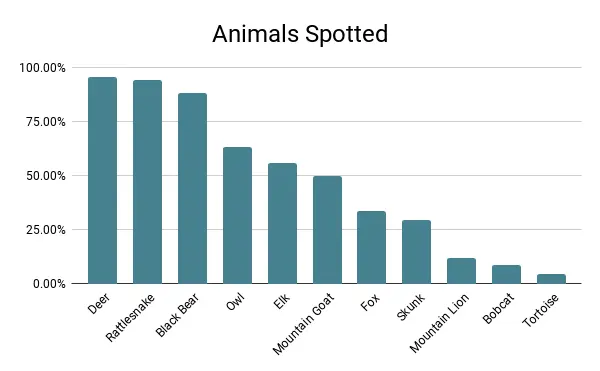
Lastly, we have some data that I don’t really feel fits anywhere else and so I’ve just decided to tack it on at the end. What kind of wildlife did PCT hikers see on the trail?
The most common animals? Deer. The worst. The rarest of the animal kingdom? Tortoise. I’ve hiked the Desert section of the PCT twice now and I have yet to see one of these mythical creatures.
Lastly, I would wager that some percentage of the 11.8% who reported “seeing” a mountain lion simply saw some eyes in the dark that were probably (most certainly) not a mountain lion. Just saying.
Animals Hikers Spotted
- 95.6% Deer
- 94.1% Rattlesnake
- 88.2% Black Bear
- 63.2% Owl
- 55.9% Elk
- 50% Mountain Goat
- 33.8% Fox
- 29.4% Skunk
- 11.8% Mountain Lion
- 8.8% Bobcat
- 4.4% Tortoise
Support the Survey
Every year, I get a lot of people asking how to support the surveys. Beyond sharing them with your close-knit bubble of weird hiker friends, the best way to support the survey is to contribute via Patreon. You’ll get access to exclusive posts, discount codes, live streams, and super, extra cool stickers so that everyone will know how cool you are.
If you’re not into Patreon, that’s cool; you can Venmo @halfwayanywhere, Cash app $halfwayanywhere, or PayPal moc.erehwynayawflah@tcatnoc
This is not expected. The data collected in the survey will always be free and accessible to everyone who wants/needs it. Your support is much appreciated and helps pay the website (and survey) bills.


Pacific Crest Trail Survey Collection
Finally, another HUGE THANK YOU to all the hikers who completed this year’s survey. If you have any feedback, comments, suggestions to improve the survey, or data you would like to see in future posts or surveys, leave a comment below and let me know!
Affiliate Disclosure: This page may contain affiliate links, which means I may receive small commissions for purchases made via these links at no additional cost to you. This helps pay the bills and keep the site up and running. Thank you for your support!