Pacific Crest Trail Hiker Survey (2023)
The Pacific Crest Trail Hiker Survey is distributed to PCT hikers at the end of the hiking season every year to capture a snapshot of the year’s class and provide a useful resource to future PCT hikers and recreators. The Survey is now in its eleventh year, and I would like to thank everyone who took the time to participate and provide feedback.
This year’s survey is the most comprehensive yet, and I’ve devoted a tremendous amount of time to compiling the results. Again, the PCT Survey is meant to be a useful resource to help anyone interested in hiking the Pacific Crest Trail figure out how to approach the seemingly monstrous journey. Every year, I try to improve the data collected and fine-tune the presentation to help hikers best. I would love to hear what you think in the comments below.
Congratulations on arriving at a spot in the PCT Survey that most readers have probably skipped. There’s a lot to cover (I’ll probably need to split this initial article into multiple posts in the future), so I won’t waste your time with any more filler. Here are Halfway Anywhere’s 2023 Pacific Crest Trail Hiker Survey results!
Notes on the Data
- This year, there were 751 completed surveys. Hiking next year? Sign up to take the survey here.
- Some responses are sorted and colored – e.g., northbound or southbound. More on this below.
- The Pacific Crest Trail and thru-hiking generally use acronyms and jargon. If anything is unclear, the thru-hiker glossary may help. Please comment if you still can’t find what you’re looking for.
- I ask that respondents do their best to respond accurately. Not every hiker answers every question, and not every answer is guaranteed 100% accurate (e.g., someone may report taking 17 instead of 16 zero days).
- I refer to survey respondents collectively as this year’s “class.” Remember, this is a sample (albeit a large one) and not a comprehensive survey of every person on the PCT.
- These results invoke basic statistics. To maximize your time here, familiarize yourself with average, median (M), and standard deviation (σ).
- For stats requiring the length of the PCT for a calculation (e.g., mileage/day), I use 2,655.2 mi / 4,273.1 km (from the FarOut Guides PCT app).
- More detailed posts focused on PCT Gear (including breakdowns of women-specific gear and couples’ gear), PCT Resupply, PCT Demographics, PCT Horror Stories, and PCT Advice in the coming weeks. If you would like to be notified of new surveys, click here.
Data Labels
- Thru-Hikers: Thru-hikers
- Thru-Hikers (0): Thru-hikers who didn’t complete the PCT
- Thru-Hikers (1): Thru-hikers who completed the PCT
- Northbound: Northbound thru-hikers
- Southbound: Southbound thru-hikers
If no label has been appended, I used all collected data (i.e., it includes section hiker data).
Unless otherwise noted, I use the following colors to differentiate each section of the Pacific Crest Trail. These colors are typically used in the graphs below.
- The Desert, the Sierra, Northern California, Oregon, Washington
Demographics
First, let’s look at information from the Pacific Crest Trail Class of 2023 that won’t help anyone plan a thru-hike, but that’s interesting nonetheless. I delve deeper into the demographics of each year’s class in a subsequent post, but I cover the basics here to provide a picture of this year’s class.
We’ll look at PCT hiker gender, age, race, education, sexual orientation, country/state of origin, marital status, children, and employment (including how hikers could take time off to hike the PCT).
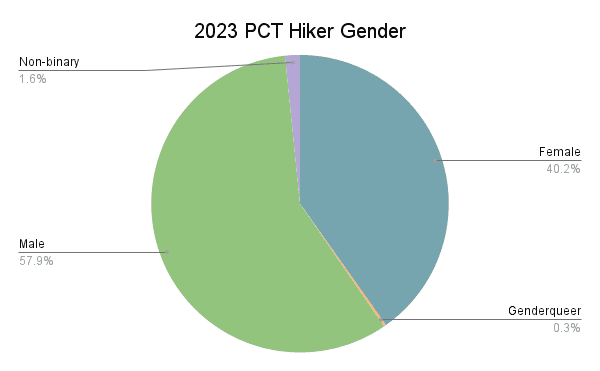
PCT Hiker Gender
- 57.9% – Male
- 40.2% – Female
- 1.6% – Non-binary
- 0.3% – Genderqueer
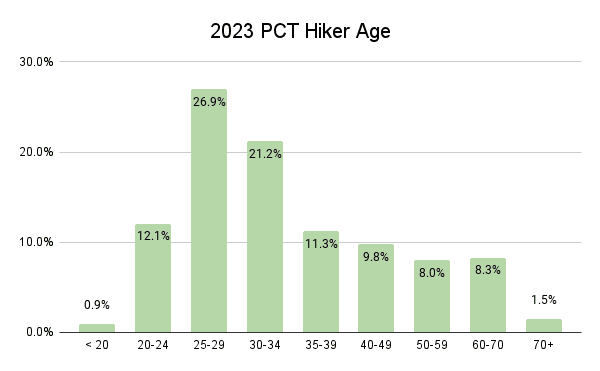
PCT Hiker Age
- 0.9% – < 20
- 12.1% – 20-24
- 26.9% – 25-29
- 21.2% – 30-34
- 11.3% – 35-39
- 9.8% – 40-49
- 8.0% – 50-59
- 8.3% – 60-70
- 1.5% – 70+
Average age: 36
Median age: 32
σ: 13
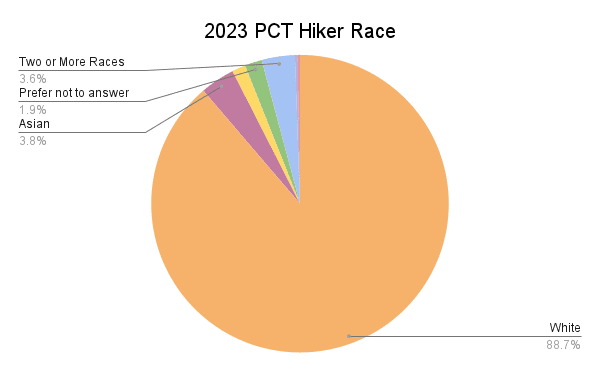
PCT Hiker Race
- 88.7% – White
- 3.8% – Asian
- 3.6% – Two or More Races
- 1.5% – Hispanic or Latino
- 0.3% – American Indian or Alaska Native
- 0.3% – Middle Eastern
- 1.9% – Prefer not to answer
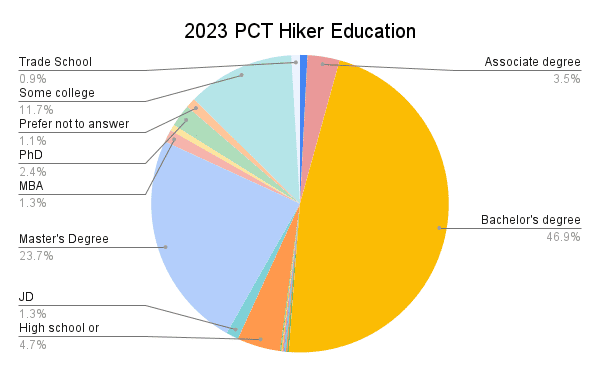
PCT Hiker Education
- 46.9% – Bachelor’s degree
- 23.7% – Master’s Degree
- 11.7% – Some college
- 4.7% – High school or equivalent
- 3.5% – Associate degree
- 2.4% – PhD
- 1.3% – JD
- 1.3% – MBA
- 0.9% – Trade School
- 0.8% – 12th grade or less
- 0.7% – MD
- 0.1% – CPA
- 0.1% – DCS/DEC
- 0.1% – DDS
- 0.1% – DO
- 0.1% – DPT
- 0.1% – DVM
- 0.1% – EdD
- 1.1% – Prefer not to answer
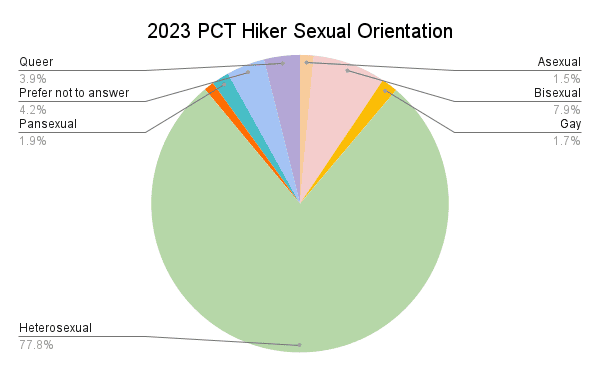
PCT Hiker Sexual Orientation
- 77.8% – Heterosexual
- 7.9% – Bisexual
- 3.9% – Queer
- 1.9% – Pansexual
- 1.8% – Gay
- 1.5% – Asexual
- 1.1% – Lesbian
- 4.17% – Prefer not to answer
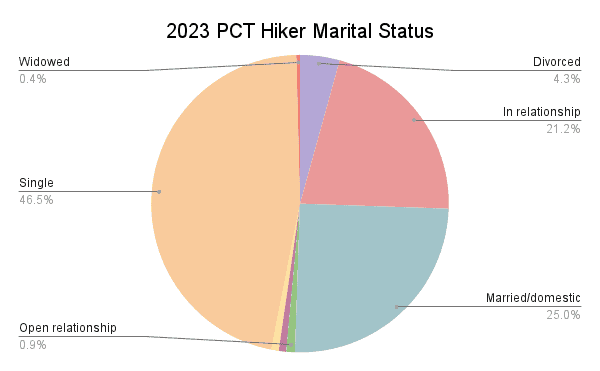
PCT Hiker Marital Status
- 46.5% – Single
- 25.0% – Married/domestic partnership
- 21.2% – In relationship
- 4.3% – Divorced
- 0.9% – Open relationship
- 0.8% – Separated
- 0.4% – Widowed
- 0.8% – Prefer not to answer
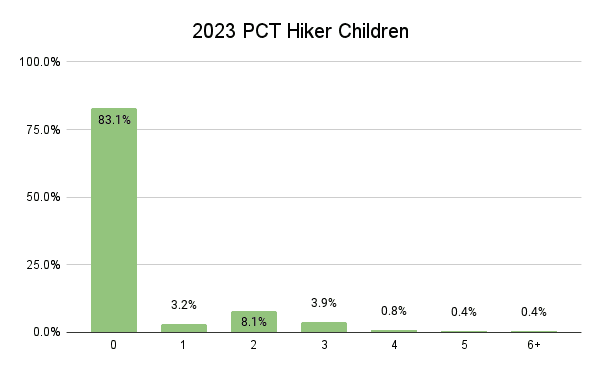
PCT Hiker Children
- 83.1% – No children
- 3.2% – One child
- 8.1% – Two children
- 3.9% – Three children
- 0.8% – Four children
- 0.4% – Five children
- 0.4% – Over five children
Where Hikers Are From
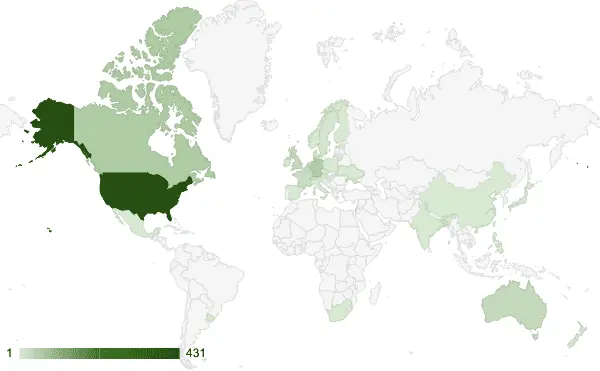
With its growing popularity, the Pacific Crest Trail attracts people from across the United States and the world. Here’s a look at where hikers on the trail this year hailed from.
- Aruba, Australia, Austria, Bangladesh, Belgium, Canada, China, Czechia, Denmark, England, Estonia, Finland, France, Germany, Hungary, India, Ireland, Israel, Italy, Japan, Lithuania, Mexico, Netherlands, New Zealand, Northern Ireland, Norway, Philippines, Poland, South Africa, Spain, Sweden, Switzerland, Taiwan, Ukraine, United Kingdom, United States, Uruguay (37 total)
Worldwide PCT Hiker Distribution
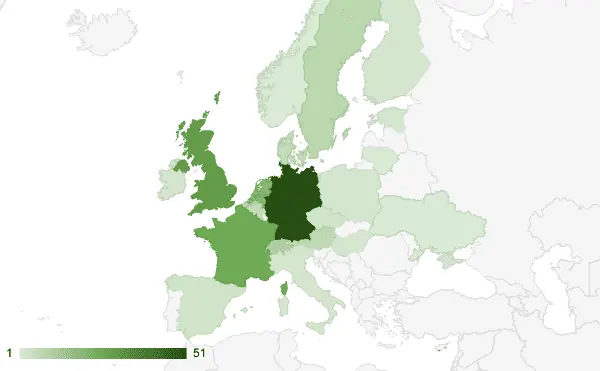
European PCT Hiker Distribution
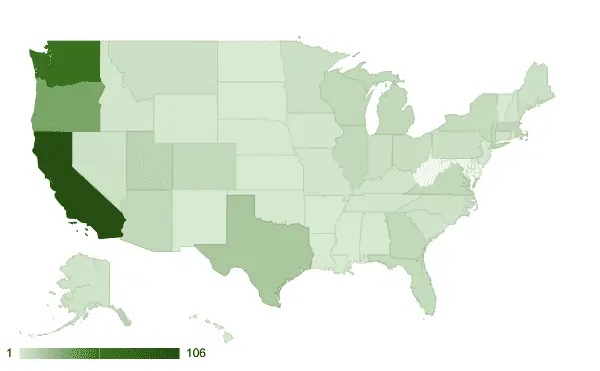
USA PCT Hiker Distribution
Alabama, Alaska, Arizona, Arkansas, California, Colorado, Connecticut, District of Columbia, Florida, Georgia, Hawaii, Idaho, Illinois, Indiana, Iowa, Kansas, Kentucky, Louisiana, Maine, Massachusetts, Michigan, Minnesota, Mississippi, Missouri, Montana, Nebraska, Nevada, New Hampshire, New Jersey, New Mexico, New York, North Carolina, North Dakota, Ohio, Oklahoma, Oregon, Pennsylvania, Rhode Island, South Carolina, South Dakota, Tennessee, Texas, Utah, Vermont, Virginia, Washington, Wisconsin, Wyoming (48 total)
The Most-Represented Countries
- United States – 58.5%
- Canada – 7.7%
- Germany – 6.9%
- Australia – 4.2%
- United Kingdom – 3.9%
The Most-Represented States
- 25.3% – California
- 14.8% – Washington
- 7.6% – Oregon
- 4.1% – Texas
- 2.6% – Utah
Hiker Jobs & Working Conditions
How can you take off enough time to hike across the United States? This is probably a question most would-be Pacific Crest Trail hikers have been asked. I ask hikers what they do for work (when they’re not being incredible hiking machines) and how they can take time off to hike the PCT.
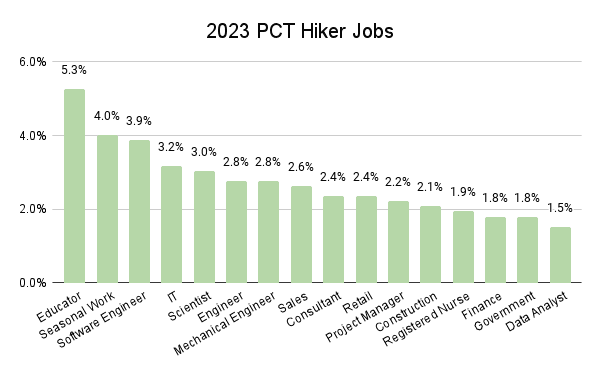
PCT Hiker Jobs
This year, hikers reported 166 different professions. The most common of which were:
- 5.3% – Educator/Teacher
- 4.0% – Seasonal Work
- 3.9% – Software Engineer
- 3.2% – IT
- 3.0% – Scientist
- 2.8% – Engineer
- 2.8% – Mechanical Engineer
- 2.6% – Sales
- 2.4% – Consultant
- 2.4% – Retail
9.4% (larger than any profession) reported being retired, and 5.0% were students. More on this in the next section.
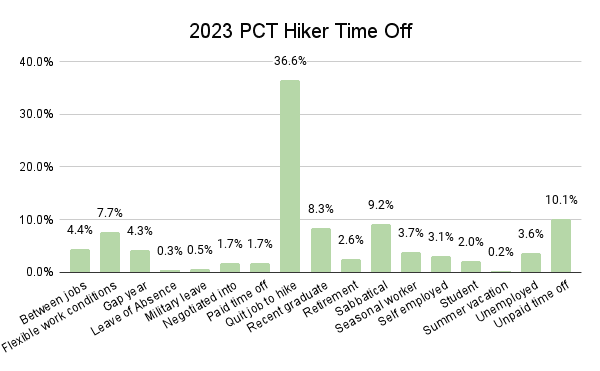
PCT Hiker Working Conditions
How were this year’s thru-hikers able to take the time to hike the PCT?
- 36.6% – Quit job to hike
- 10.1% – Unpaid time off
- 9.2% – Sabbatical
- 8.3% – Recent graduate
- 3.7% – Seasonal worker
- 3.6% – Unemployed
- 3.1% – Self employed
- 2.6% – Retirement
- 2.0% – Student
- 1.7% – Negotiated into employment
- 1.7% – Paid time off
- 0.5% – Military leave
- 0.3% – Leave of Absence
- 0.2% – Summer vacation
Hiker Experience & Training
Here’s a look at what the 2023 class of thru-hikers looked like during their “Planning a PCT Hike” phase. This section examines time spent planning, first-time hikers, hiker experience level, and other trails hiked.
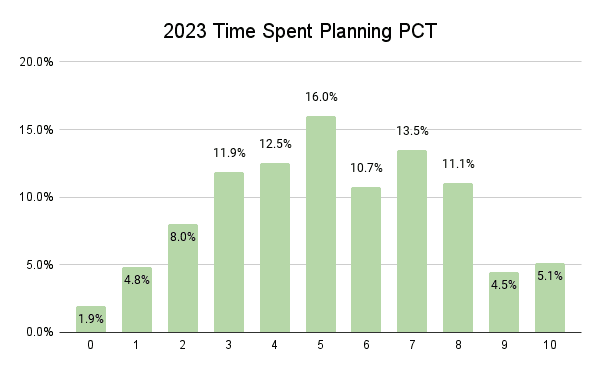
Time Spent Planning
I ask thru-hikers how much time they spend planning for their thru-hikers on a scale of 0 (no time at all) to 10 (every waking moment). I will drill down in a future post on whether this impacted hikes.
- 0 – 1.9%
- 1 – 4.8%
- 2 – 8.0%
- 3 – 11.9%
- 4 – 12.5%
- 5 – 16.0%
- 6 – 10.7%
- 7 – 13.5%
- 8 – 11.1%
- 9 – 4.5%
- 10 – 5.1%
Average: 5.25
Median: 5
σ: 2.48
PCT Hiker Experience Level
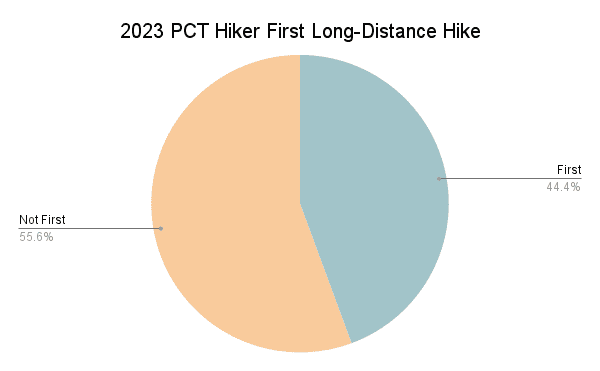
Instead of asking thru-hikers whether this would be/was their first long-distance hike, I ask the length of thru-hikers‘ longest hike to date (pre-PCT) – more on the specifics of this below.
I use 100 mi / 160 km as the cutoff for a long-distance hike (sorry, Wonderland Trail hikers).
First Time Thru-Hikers
- 44.4% – First long-distance hike
- 55.6% – Not first long-distance hike
Average trail hiked: 434 mi / 698 km
Median: 100 mi / 161 km
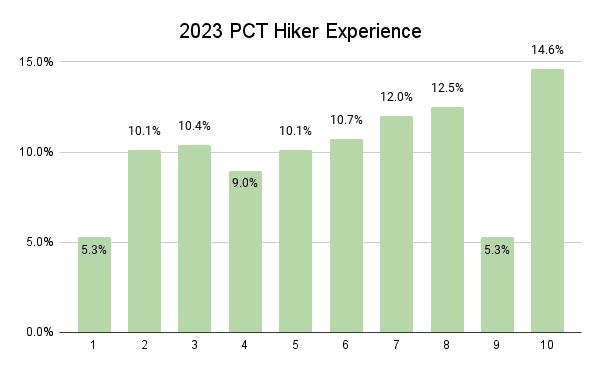
PCT Hiker Experience
In addition to asking about the longest trail completed by thru-hikers pre-PCT, I ask thru-hikers to evaluate their backpacking experience on a scale of 1 to 10.
- Average experience: 5.85
- Median experience: 6
- σ: 2.78
Thru-Hikers (1): 6.04 | σ = 2.82
Thru-Hikers (0): 5.48 | σ = 2.68
Previous Trails Hiked
The trails most commonly hiked by those with experience were:
- Appalachian Trail – 15.9%
- John Muir Trail – 13.0%
- PCT Section Hike – 11.6%
- Tour du Mont Blanc – 7.2%
- Tahoe Rim Trail – 6.9%
- Colorado Trail – 6.6%
- West Highland Way – 6.4%
- Camino de Santiago – 6.1%
- Kungsleden – 5.5%
- AT Section Hike – 5.2%
- GR20 – 5.2%
- Te Araroa – 4.0%
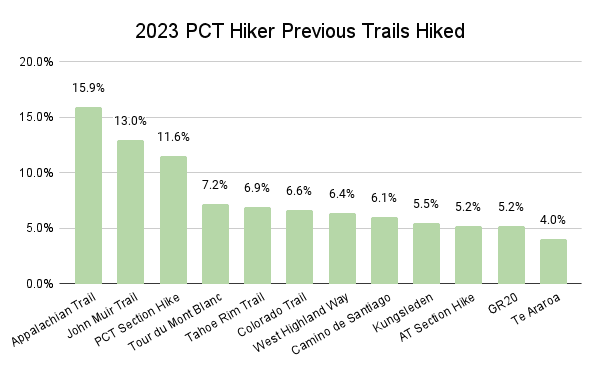
Note: these percentages are for the hikers who have already completed a long-distance hike, not the entire class.
Pre-Hike Training
Next, we’ll examine whether thru-hikers trained in preparation for their thru-hikes, what they did (if anything) to train, and how thru-hikers rated their fitness (pre-PCT).
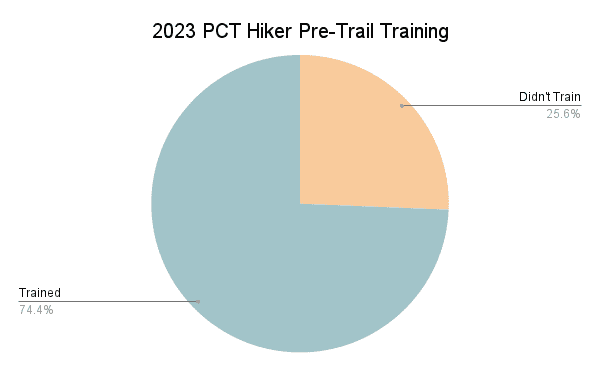
Hiker Training Before Trail
- 74.4% – Trained
- 25.6% – Didn’t Train
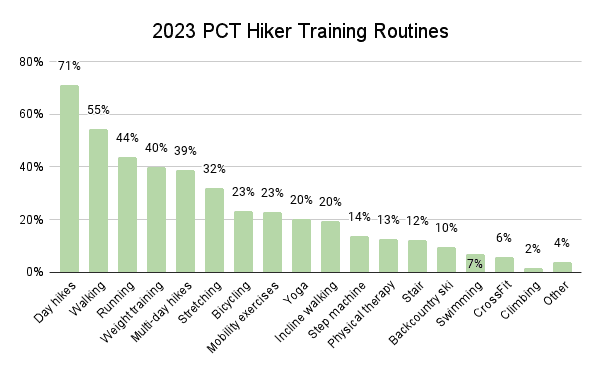
How Hikers Trained
- 71.3% – Day hikes
- 54.5% – Walking
- 44.0% – Running
- 39.9% – Weight training
- 38.8% – Multi-day hikes
- 32.1% – Stretching
- 23.1% – Bicycling
- 22.8% – Mobility exercises
- 20.0% – Yoga
- 19.6% – Incline walking
- 13.8% – Step machine
- 12.5% – Physical therapy
- 12.3% – Stair running/walking
- 9.7% – Backcountry ski/snowboard
- 6.9% – Swimming
- 5.6% – CrossFit
- 1.5% – Climbing
- 3.7% – Other
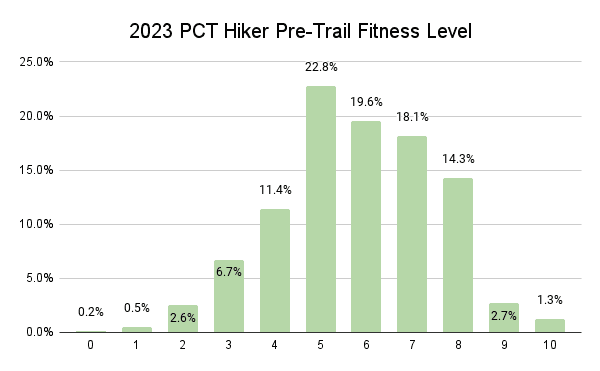
Pre-Trail Fitness Level
I asked thru-hikers to rate their fitness level (on a scale of 0 to 10) before beginning the trail.
- 0 – 0.2%
- 1 – 0.5%
- 2 – 2.6%
- 3 – 6.7%
- 4 – 11.4%
- 5 – 22.8%
- 6 – 19.6%
- 7 – 18.1%
- 8 – 14.3%
- 9 – 2.7%
- 10 – 1.3%
Average fitness: 5.81
Median fitness: 6
σ: 1.75
Thru-Hikers (1): 5.94 | σ = 1.67
Thru-Hikers (0): 5.53 | σ = 1.85
Southern & Northern Terminus Travel
The question of whether to hike the Pacific Crest Trail northbound or southbound is perhaps one of the first questions hikers have to answer once they commit to a thru-hike.
I will post a more detailed breakdown of northbound versus southbound PCT thru-hikers this year. For now, we’ll look at why hikers chose to go southbound (northbound is the more popular option for thru-hikers). I also asked hikers this year, for the first time, about their travel to and from the southern and northern terminuses at the starts and ends of their hikes.
Northbound Thru-Hikers
Getting to the Southern Terminus
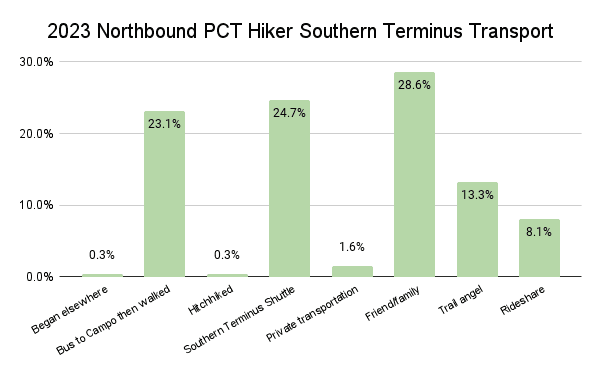
Here’s how northbound thru-hikers got to the southern terminus of the PCT to begin their hikes.
- 28.6% – Friend/family
- 24.7% – Southern Terminus Shuttle
- 23.1% – Bus to Campo, then walked
- 13.3% – Trail angel
- 8.1% – Rideshare
- 1.6% – Private transportation
- 0.3% – Began elsewhere
- 0.3% – Hitchhiked
Leaving the Northern Terminus
When northbound PCT hikers reach the northern terminus at the US/Canada border, they (typically) have the option of crossing into Canada and hiking to Manning Park (done via obtaining prior authorization) or turning around and hiking back to Harts Pass in Washington.
This is because there is no vehicle access at the northern terminus.
However, there are Here’s how hikers responded to the question, “Did you cross the US/Canada Border and hike into Manning Park?”
- 57.3% – Hiked into Manning Park
- 37.2% – Hiked back to Harts Pass
- 2.6% – Stopped due to fires
- 1.8% – Ended elsewhere
- 1.0% – Alternate border location finish
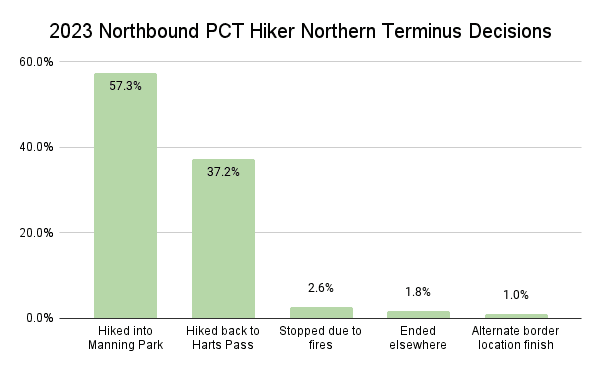
Note: these percentages are for northbound PCT hikers who completed the PCT.
Southbound Thru-Hikers
Southbound PCT hikers begin their hikes with a logistical challenge.
To officially begin at the northern terminus, they first need to reach Harts Pass in Washington (the closest road access in the US to the border). Then, they need to hike northbound nearly 31 mi / 50 km to reach the northern terminus at the US-Canada Border.
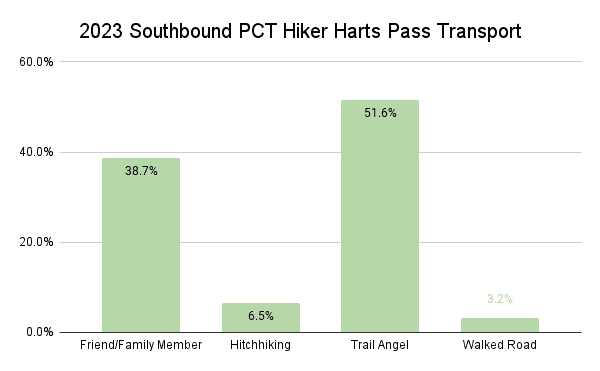
Getting to Harts Pass
Here’s how southbound thru-hikers got to Harts Pass to begin their hikes.
- 51.6% – Trail Angel
- 38.7% – Friend/Family Member
- 6.5% – Hitchhiking
- 3.2% – Walked Road
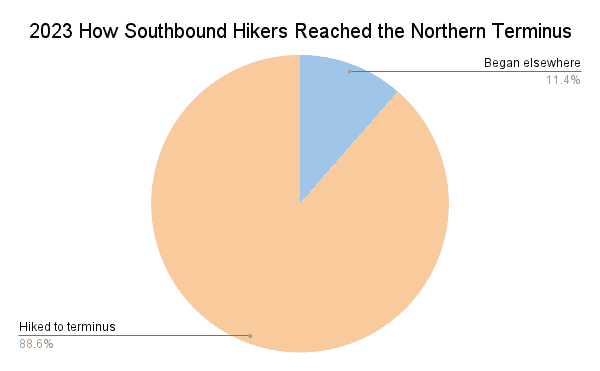
Getting to the Northern Terminus
Here’s how southbound thru-hikers got to the northern terminus of the PCT to begin their hikes.
- 88.6% – Hiked to the terminus
- 11.4% – Began hike elsewhere
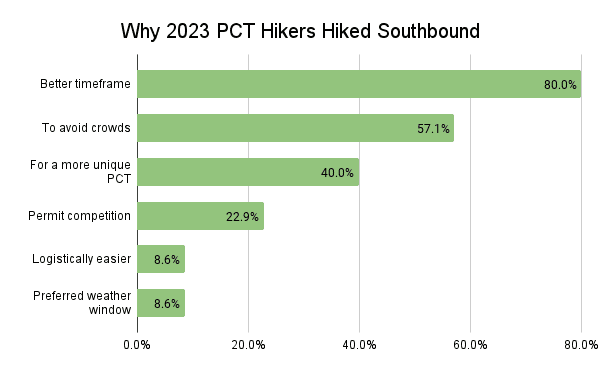
Why Hikers Went Southbound
Here are the motivations behind southbound thru-hiker decisions to begin their hikes at the US-Canada Border.
- 80.0% – Better timeframe
- 57.1% – To avoid crowds
- 40.0% – For a more unique PCT
- 22.9% – Permit competition
- 8.6% – Logistically easier
- 8.6% – Preferred weather window
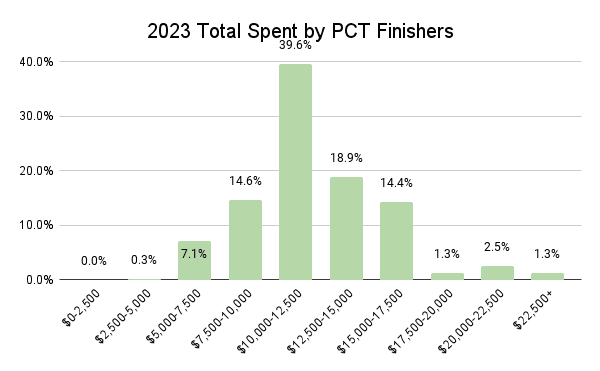
Money Spent on Hike
How much does it cost to hike the Pacific Crest Trail? This a question on the minds of many thru-hikers before starting their hikes. The safe answer? More than you think. I wrote an article on PCT costs, but the aggregate data from this year’s class will paint a more accurate picture.
Thru-Hikers (1)
$10,216
The average amount spent on the entirety of a thru-hike
M = $10,000 | σ = $3,800
Thru-Hikers (1)
$66
The average amount spent per day on a thru-hike
M = $63 | σ = $26
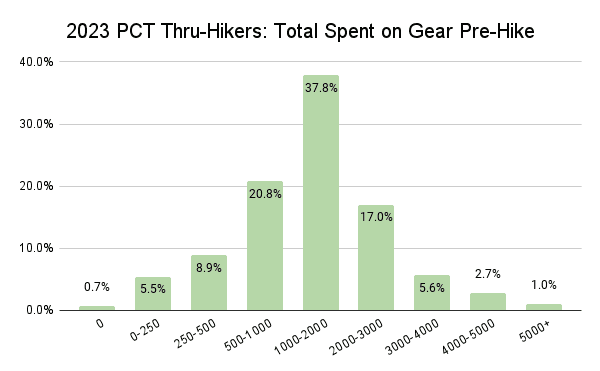
Thru-Hikers
$1,728
The average amount spent on gear before starting
M = $1,500 | σ = $1,173
Thru-Hikers (1)
$9,770
Average spent by domestic thru-hikers
M = $7,000 | σ = $3,688
Thru-Hikers (1)
$10,733
Average spent by international thru-hikers
M = $9000 | σ = $5,567
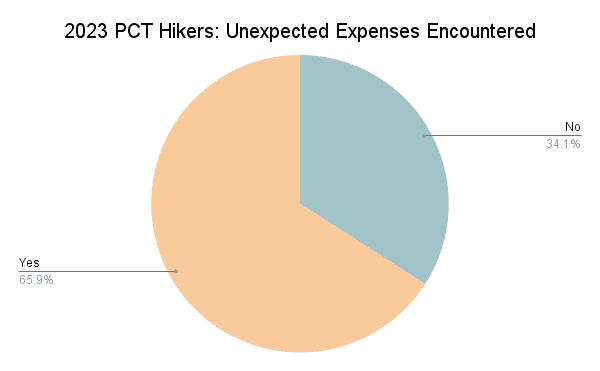
I asked Pacific Crest Trail hikers if they encountered any unexpected expenses while hiking the PCT. Even if you purchase and test all your gear beforehand and pre-package all of your resupplies (I recommend against this resupply strategy), you can’t predict what will happen during a PCT thru-hike.
Surprise Expenses Encountered
- 65.9% Yes
- 34.1% No
Unexpected expenses fell into three categories: gear replacement, hotel stays, and travel along the trail. However, a few hikers did report some towns being unexpectedly pricey and medical expenses in addition to these three larger reasons.
Hiking Partners, Camping, & Alone Time
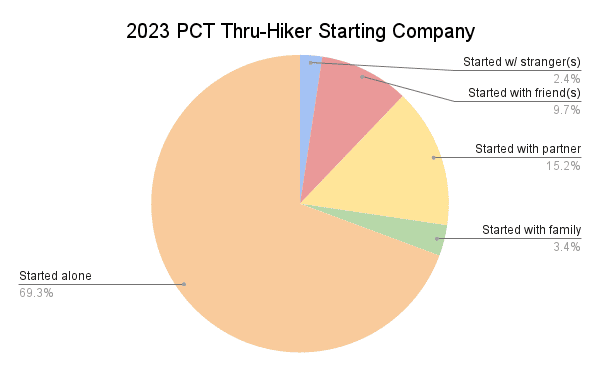
Beginning a thru-hike on your own can sound scary and intimidating, but every year, most thru-hikers (and hikers in general) begin their hikes alone. Here, we’ll look at who hikers began with, how much time they spent hiking and camping alone (and cowboy camping), whether they stayed with their hiking partner(s), hiking group sizes, and hiker relationships.
Did hikers begin alone?
- 69.3% – Started alone
- 15.2% – Started with partner
- 9.7% – Started with friend(s)
- 3.4% – Started with family
- 2.4% – Started with stranger(s)
Of this year’s first-time thru-hikers, 71.4% began their hikes alone.
Time Hiking Alone
- 6.7% – 0%
- 8.8% – 1-10%
- 5.1% – 11-20%
- 5.5% – 21-30%
- 3.4% – 31-40%
- 7.9% – 41-50%
- 3.8% – 51-60%
- 7.8% – 61-70%
- 16.1% – 71-80%
- 18.1% – 81-90%
- 14.1% – 91-99%
- 2.8% – 100%
70.9% – Average time thru-hikers who began alone spent hiking alone
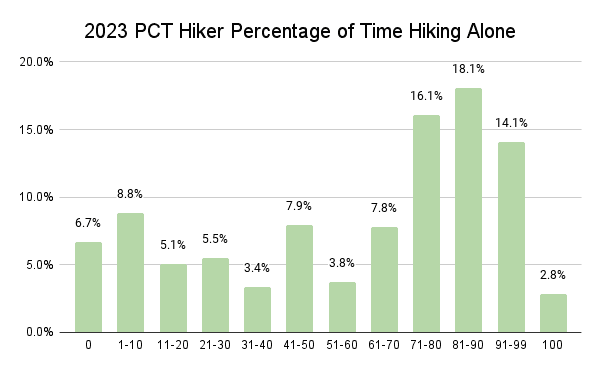
“Hiking alone” measures how long hikers weren’t physically walking with someone down the trail. It does not necessarily imply they weren’t hiking with others throughout the day (i.e. camping with others).
Nights Camped Alone
- 23.3% – 0%
- 32.3% – 1-10%
- 9.4% – 11-20%
- 5.4% – 21-30%
- 5.4% – 31-40%
- 6.3% – 41-50%
- 3.2% – 51-60%
- 2.1% – 61-70%
- 5.4% – 71-80%
- 3.6% – 81-90%
- 2.1% – 91-99%
- 1.6% – 100%
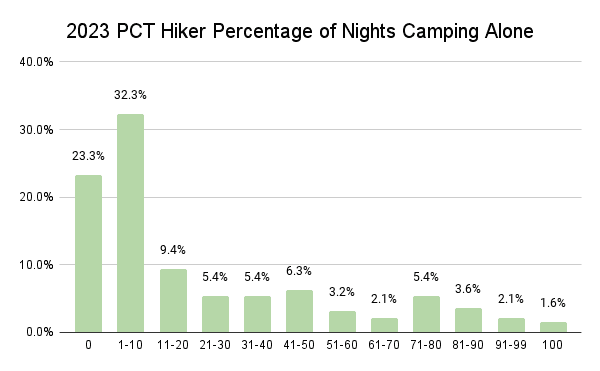
22.8% was the average percentage of nights thru-hikers spent camping alone (M = 10 | σ = 29). When we look at thru-hikers who finished, this translates to an average of 30 nights spent camping alone.
Nights Cowboy Camping
- 26.2% – 0%
- 47.7% – 1-10%
- 9.1% – 11-20%
- 6.5% – 21-30%
- 2.1% – 31-40%
- 2.9% – 41-50%
- 1.1% – 51-60%
- 1.9% – 61-70%
- 1.3% – 71-80%
- 0.5% – 81-90%
- 0.7% – 91-99%
- 0.0% – 100%
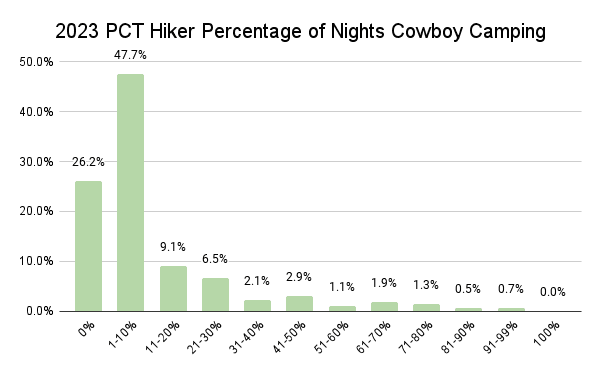
12.7% was the average percentage of nights thru-hikers spent cowboy camping (σ = 19 | M = 5). When we look at thru-hikers who finished, this translates to an average of 18 nights spent cowboy camping.
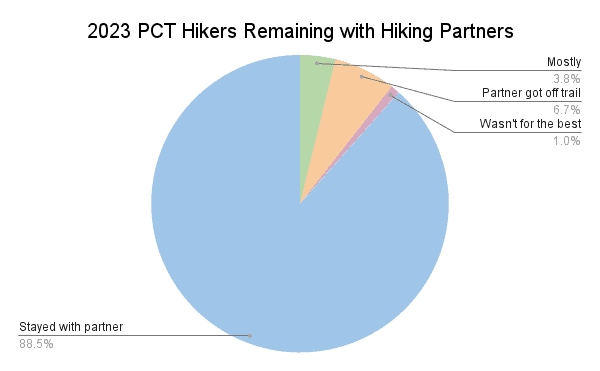
Sticking With Hiking Partner(s)
Beginning a hike with someone is one thing, but remaining together and finishing it with someone is arguably as impressive as the trail itself. Here’s how things worked out for those who began their hikes with another person.
Remaining with Partner(s)
- 88.5% – Stayed with partner
- 6.7% – Partner got off the trail
- 3.8% – Mostly
- 1.0% – Wasn’t for the best
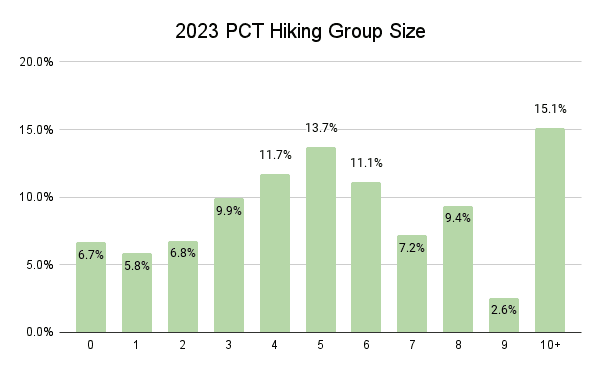
Size of Hiking Groups
Despite most hikers beginning their Pacific Crest Trail hikes alone, hikers commonly will link up and hike with at least one other person for a considerable amount of their time on the PCT. Some hikers refer to this as a trail family or “tramily“.
Here are the largest groups hikers found themselves hiking with regularly.
Average group size: 5.7
Median size: 5
σ: 3.8
Relationship Status
I ask thru-hikers, “At the start of the PCT, were you in a relationship?”
- 42.7% – No, still single
- 43.5% – Yes, still with the same person
- 6.9% – No, but now I am in a relationship with someone I met on the PCT
- 3.8% – Yes, but I am now single
- 1.3% – No, but now I am in a relationship with someone I met before the PCT
- 1.4% – Yes, but now I am in a relationship with someone I met on the PCT
- 0.3% – Yes, but now I am in a relationship with someone I met before the PCT
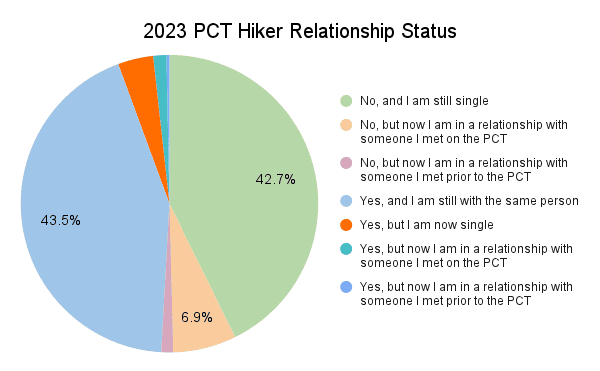
Overall, the PCT ended 3.8% of hiker relationships but gave new relationships to 1.4% of hikers, a net loss of 2.4%.
Permits & Starting Dates
The rules and procedures for obtaining and possessing a Pacific Crest Trail permit constantly evolve. As expected, northbound permit slots for March, April, and May filled up quickly and completely this year. If everything operated exactly as official permits dictate, 50 hikers began northbound hikes daily from the southern terminus.
99% of thru-hikers reported having obtained a permit from the PCTA. Is this a good thing? Yes. If you’re hiking the PCT, should you get a permit? Absolutely. If you are considering hiking the PCT without a permit, don’t.
Here, we look at whether hikers got permits for the start dates they wanted, whether they began their hikes on their permit start dates, and what the average start dates were for finishers and those who wish they had started earlier or later.
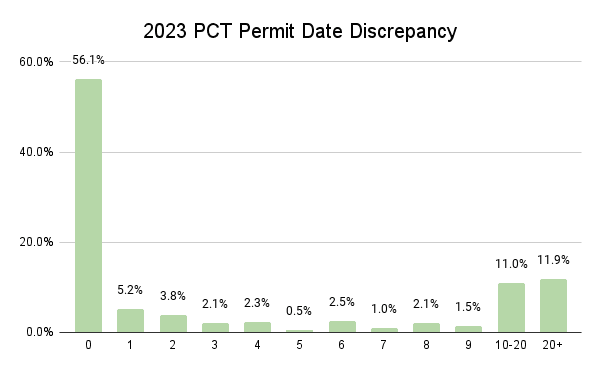
Did hikers receive a permit for the day they wanted?
Permits for the PCT are (generally) issued in two phases and require you to preregister and be online at a designated time, as hikers are randomly allowed to request permit start dates.
I asked this year’s class whether they got a permit for the date they wanted and whether they were happy with their permit’s date.
- 56.1% Permit for date wanted
- 61.3% Permit +/- 1 day of date wanted
- 67.2% Permit +/- 3 days of date wanted
- 70% Permit +/- 5 days of date wanted
- 77.1% Permit +/- 10 days of date wanted
- 88.1% Permit +/- 20 days of date wanted
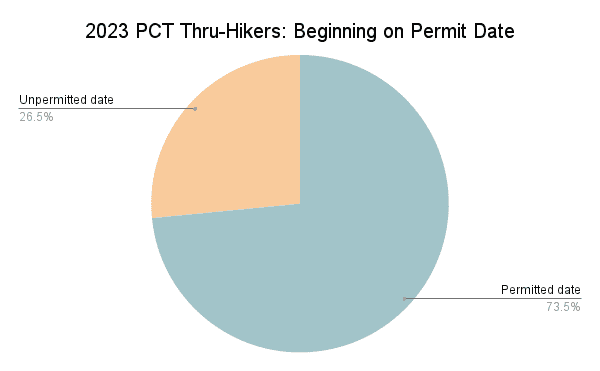
Begin on Permit Date
- 73.5% – Began on their permitted date
- 26.5% – Did not begin on their permitted date
Hiker Start Dates
Northbound
April 14
Average start date of thru-hikers happy with their start date
Northbound
March 28
Average start date of thru-hikers who said they would like to have started later
Northbound
May 3
Average start date of thru-hikers who said they would like to have started earlier
Southbound
June 28
Average start date of thru-hikers happy with their start date
Southbound
June 17
Average start date of thru-hikers who said they would like to have started later
Southbound
July 7
Average start date of thru-hikers who said they would like to have started earlier
Hiking Stats & Dates
The Pacific Crest Trail has five sections: the Desert, the Sierra, Northern California, Oregon, and Washington.
Kennedy Meadows (south) is the Desert/Sierra division (despite the Sierra range technically beginning further south), and Echo Lake/South Lake Tahoe is commonly considered the Sierra/Northern California division (yes, the Sierra technically continues north).
Basically, the Sierra section of the PCT can also be considered “the section of the PCT that is most commonly filled with snow for the largest number of hikers (i.e., northbound hikers).” That said, the Sierra section of the survey measures the distance from Kennedy Meadows to Echo Lake (just north of Echo Summit on Highway 50, where hikers typically access South Lake Tahoe).
In this section, we look at how long thru-hikers took for each section of the trail, a breakdown of hike lengths and averages, and a look at how many days hikers took off (zero/nearo days).
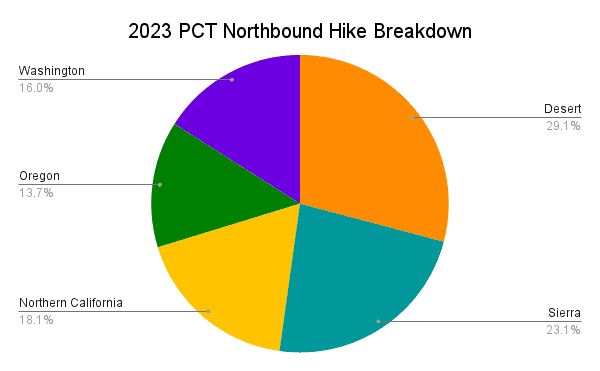
Northbound Hike Breakdown
- 48 – Average days hiking the Desert
- 38 – Average days hiking the Sierra
- 30 – Average days hiking Northern California
- 23 – Average days hiking Oregon
- 27 – Average days hiking Washington
- 160 NOBO (1) – Average days to complete the PCT
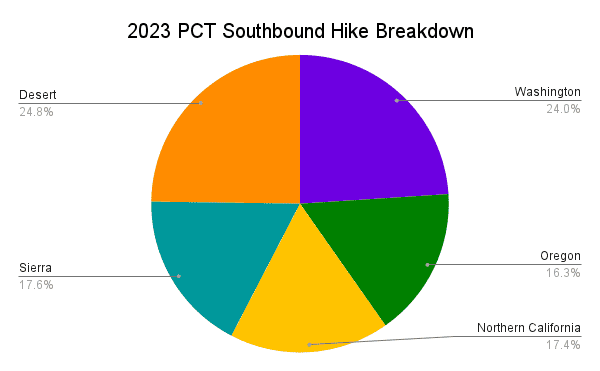
Southbound Hike Breakdown
- 34 – Average days hiking Washington
- 23 – Average days hiking Oregon
- 25 – Average days hiking Northern California
- 25 – Average days hiking the Sierra
- 35 – Average days hiking the Desert
- 121 SOBO (1) – Average days to complete the PCT
If you’re paying attention above, you may notice that simply adding up the average time for each section does not equal the average time for the entire trail. This is because I have taken all these averages independently of one another, and I do not have complete data for the dates (and, therefore, section lengths) for all hikers who completed the survey.
Length of Thru-hikes
Thru-Hikers (1)
158
The average number of days of an entire thru-hike
(M = 158 | σ = 22)
Thru-Hikers (1)
138
The average number of days hiking (total minus zero days)
(M = 138 | σ = 21)
Northbound (1)
9/22
The average finish date (22/9 for the rest of the world)
(M = 9/24 | σ = 18)
Thru-Hikers (1)
17.3 mi
The average daily mileage (27.8 km)
(σ = 3 mi / 4.8 km)
Thru-Hikers (1)
19.7 mi
The average daily mileage after removing zero days (31.7 km)
(σ = 3.7 mi / 6 km)
Thru-Hikers (1)
38.3 mi
The average longest day of hiking (61.6 km)
(M = 35 | σ = 11.3 mi / 18.2 km)
Zero and Nearo Days
Thru-Hikers (1)
20
The average number of zero days (days off from hiking)
(M = 18 | σ = 11.2)
Thru-Hikers (1)
16
The average number of nearo days (low mileage days)
(M = 15 | σ = 8.9)
Thru-Hikers (1)
7
The average longest consecutive number of zero days
(M = 5 | σ = 6.7)
Flip-Flopping, Completion Rates, & Footpaths
Flip-flopping is when a hiker skips a section of the trail (the flip), intending to return to hike it later (the flop). This can happen because a hiker wants to avoid snow, skip a fire closure, or because of some other logistical issue. The flip-flop usually takes one of two forms.
One is a hiker skipping ahead, continuing to hike in the same direction, and then returning to the point they originally departed the trail to hike the skipped section later (e.g., a northbound hiker skips from the CA/OR border to the OR/WA border, then hikes north to Canada before returning to the CA/OR border to hike north to the OR/WA border).
It can also be when a hiker skips ahead and then hikes the skipped section in the opposite direction of their original hike before jumping back up to the point where they originally skipped to and continuing their hike in the original direction (e.g., northbound hiker jumps from CA/OR border to OR/WA border and then hikes south to CA/OR border before returning to OR/WA border to continue hiking north).
Some hikers get wild with their flip-flopping (I recommend avoiding it if possible), and there are rules in place that invalidate PCT permits for the Sierra if hikers fail to hike this section continuously (hikers can still flip-flop and get local permits to hike the Sierra legally).
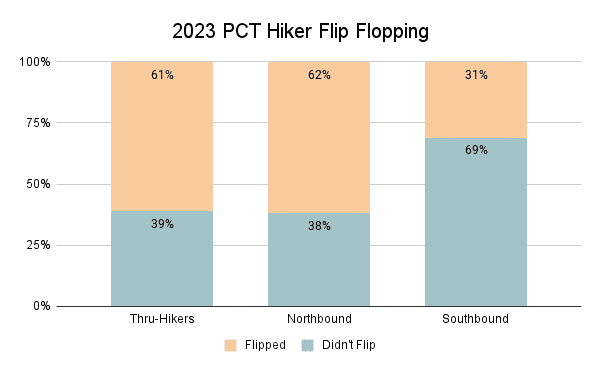
Here is what flip-flopping on the PCT looked like in 2023.
Did Hikers Flip-Flop
Thru-Hikers 61% Yes
Thru-Hikers 39% No
Northbound 62% Yes
Northbound 38% No
Southbound 31% Yes
Southbound 69% No
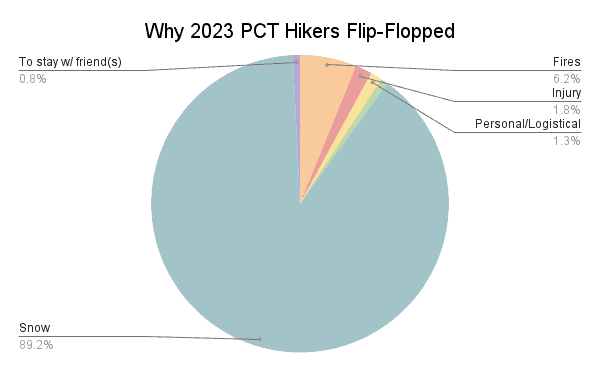
Why Hikers Flip-Flopped
- 89.2% – Snow
- 6.2% – Fires
- 1.8% – Injury
- 1.3% – Personal or logistical
- 0.8% – River crossings
- 0.8% – To meet/stay with friend(s)
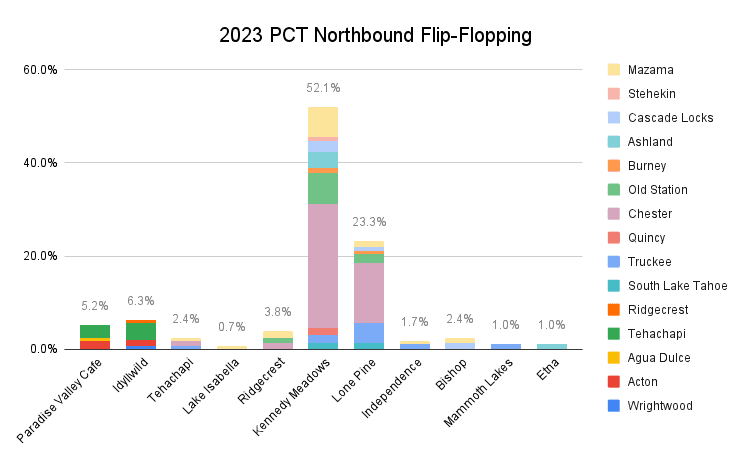
Where Hikers Flipped From/To
I’ve struggled in the past to display this information in a way I think will be helpful and accurately represent the PCT flip-flopping picture, but I think this is an improvement upon previous years. I’ve taken a few liberties here, removing any one-off flip-flops reported (i.e., the plan(s) mentioned don’t appear elsewhere) and combining places that are next to one another (e.g., Timberline Lodge and Government Camp) as a means of making the data a bit more readable. Please let me know if you have any suggestions. I am considering a more detailed flip-flopping post based on the data.
PCT Completion Rates
Most people begin a Pacific Crest Trail thru-hike intending to complete the trail. Unfortunately (or in some cases, fortunately), not everyone who sets out on this most epic adventure of border-to-border glory completes the trail. Many people hoping to hike the PCT will fail to complete the trail every year.
We will look at completion rates, but we are doing so with a caveat.
Since I distribute this survey myself, and because it is not required of PCT hikers, survey respondents are a self-selecting group who (likely) skew toward having completed the trail. A hiker who quit during their first week of hiking back in March or April probably pays little attention and cares far less about the Pacific Crest Trail survey when it’s released in the fall.
Thru-Hikers
67%
The percentage of thru-hikers who completed the PCT.
Northbound
66%
The percentage of northbound thru-hikers who completed the PCT.
Southbound
83%
The percentage of southbound thru-hikers who completed the PCT.
It may sound straightforward enough, “Did you complete the PCT? Yes or no?” but what constitutes a completed thru-hike isn’t necessarily the same for everyone.
Some people insist you need to have unbroken steps between Mexico and Canada along the official Pacific Crest Trail to constitute a thru-hike while others may forgive skipping a road walk, hitchhiking around a fire closure, or taking an alternate (or shortcut).
To better understand how much of the trail this year’s finishers hiked, I asked about footsteps between the terminuses.
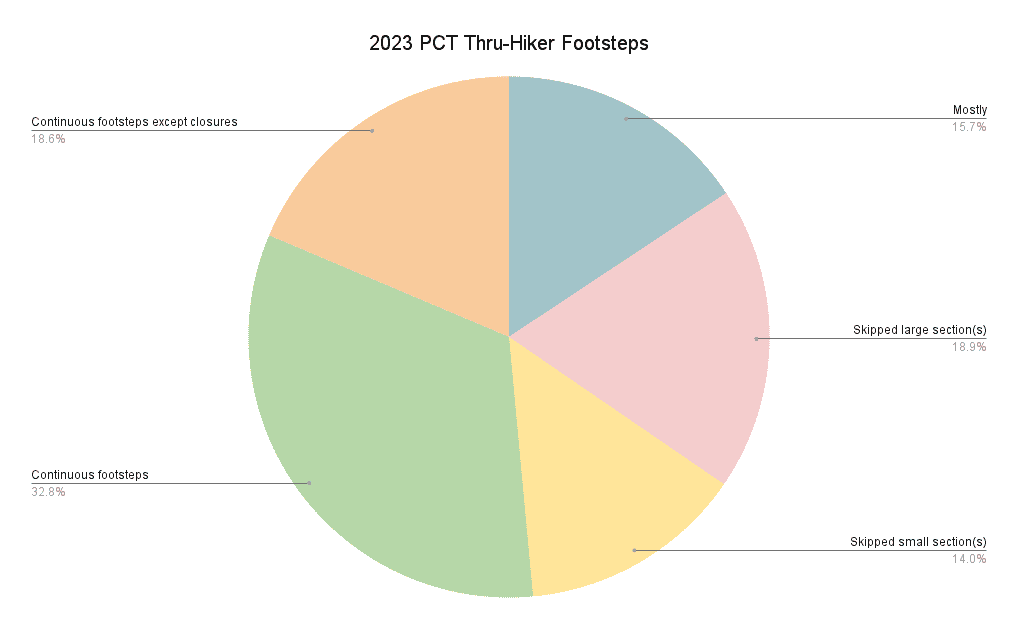
Continuous Footpaths
I ask thru-hikers (1), “Did you hike a continuous, unbroken footpath between borders?”
- 32.8% – Continuous footsteps
- 18.6% – Continuous footsteps except for closures
- 15.7% – Mostly, but may have missed a few miles
- 14.0% – Skipped or hitched past small sections
- 18.9% – Skipped or hitched past large sections
Alternate Routes
The Pacific Crest Trail is well-defined, but there are several alternate trails (sometimes, but not always, known as “shortcuts”) that hikers can take either instead of or in addition to the official PCT.
I ask about these alternates to understand what the most common PCT thru-hikes looked like. Alternates are listed in geographical order from south to north.
The following colors indicate the popularity of each alternate (the percentage of hikers who took each): over 75%, 50-75%, 25-50%, and below 25%.
Desert Alternates
- Paradise Cafe – 49.7%
- Cedar Spring Trail – 3.1%
- Forbes Saddle – 4.3%
- Tahquitz Trail – 3.3%
- Spitler Trail – 9.3%
- South Ridge Trail – 1.4%
- Ernie Maxwell Trail – 0.7%
- Devil’s Slide Trail – 22.8%
- Deer Springs Trail – 3.4%
- Marion Mountain Trail – 0.5%
- Seven Pines Trail – 0.3%
- Black Mountain Road – 20.4%
- San Jacinto Summit – 29.7%
- San Gorgonio Peak – 1.2%
- Cougar Crest Trail – 6.5%
- Acorn Trail- 21.1%
- Manzanita Trail – 1.2%
- Old Endangered Species Bypass – 14.9%
- Buckhorn Camp Detour – 5.2%
- Mount Waterman – 0.3%
- Pacifico Bypass – 0.9%
- Upper Shake Campground – 0.3%
- Highway 2 Roadwalk – 1%
Sierra Alternates
- Trail Pass Trail – 19.2%
- Cottonwood Pass Trail – 31.5%
- Army Pass Trail – 0.3%
- New Army Pass Trail – 0.3%
- Whitney Portal Trail – 17.0%
- Kearsarge Pass Trail – 65.7%
- Sawmill Pass Trail – 1.1%
- Taboose Pass Trail – 0.3%
- Bishop Pass Trail – 35.1%
- Lamarck Lakes Trail – 1.1%
- Piute Pass Trail – 32.3%
- Blayney Meadows Trail – 0.3%
- Bear Ridge Trail – 7.0%
- Goodale Pass Trail – 7.2%
- Cascade/Fish Valley Trail – 0.3%
- Duck Pass Trail – 2.5%
- Mammoth Pass Trail – 34.0%
- Devils Postpile Trail – 32.6%
- John Muir Trail (between Red’s Meadow and Thousand Island Lake) – 14.8%
- Tuolumne Campground Trail – 6.1%
- John Muir Trail to Yosemite Valley – 1.4%
Northern California Alternates
- Sierra City Road Walk – 27.9%
- Sierra Buttes – 8.8%
- Old Packer Lake Road Walk – 2.7%
- Bucks Lake Alternate – 7.2%
- Subway Cave Loop Trail – 50.4%
- Kettlebelly Trail – 1.3%
- Castella Trail – 5.3%
Oregon Alternates
- Callahan’s Side Trail – 14.3%
- Hyatt Lake Resort – 7.3%
- Fish Lake Resort Side Trail – 17.7%
- Mazama Campground (Crater Lake) – 62.1%
- Crater Lake Rim Alternate – 80.4%
- Mount Thielsen – 5.9%
- South Sister – 0.8%
- Whitefish Horse Camp Trail – 7.9%
- Shelter Cove Trail – 53.4%
- Elk Lake Resort Trail – 21.0%
- Big Lake Youth Camp Trail – 46.6%
- Paradise Park Trail – 6.5%
- Timberline Trail (loop) – 4.3%
- Ramona Falls Alternate – 61.5%
- Eagle Creek Trail – 66.4%
- Mt McLaughlin – 1.0%
Washington Alternates
- Sheep Lake – 5.2%
- Stevenson Roadwalk – 0.4%
- Old PCT Route past Old Snowy Mountain – 50.97%
- Shoe Lake Alternate – 5.2%
- White Pass Road Walk – 30.7%
- Leech Lake Trail – 1.1%
- American Lake Side Trail – 0.9%
- Goldmyer Hot Springs Alternate – 0.4%
- Holman Fire Detour – 1.5%
- Miner’s Ridge Trail – 3.7%
- Stehekin Side Trail – 13.6%
- Robinson Creek Trail – 0.9%
- Billy Goat Trail – 1.1%
- Airplane Lake Fire Detour – 1.7%
- Blue Lake Fire Detour – 2.6%
Not an alternate, but instead a side trip (typically done as an out-and-back from the PCT), hikers on the Pacific Crest Trail pass just west of Mount Whitney in the Sierra.
The highest peak in the Continental United States at 14,505 ft / 4,421 m, it’s a tempting investment of time that most hikers take advantage of (the trip up from the PCT is easier, shorter, and less crowded than the trip up from the Whitney Portal Trailhead on the eastern side).
Note: A PCT permit allows you to day hike Mount Whitney from the western side (i.e., from the PCT). You are not permitted to exit the Sierra via Whitney Portal or camp east of the Crabtree Ranger Station (this includes Guitar Lake).
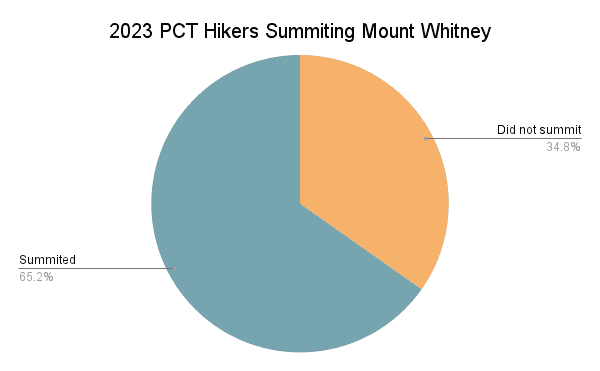
Summit Mount Whitney
Did PCT hikers summit Mount Whitney?
- 65.2% Summited Mount Whitney
- 34.8% Did not summit Mount Whitney
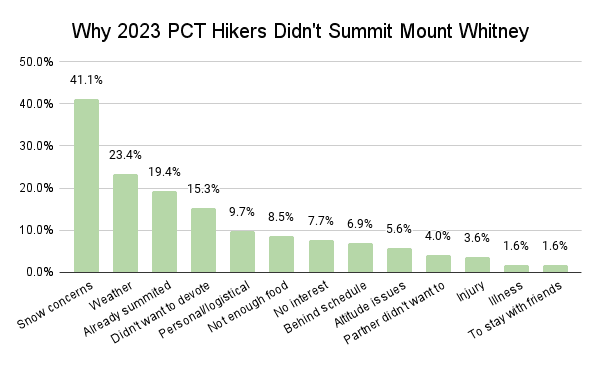
Why Hikers Didn’t Summit
I asked hikers who didn’t summit Mount Whitney (but hiked the Sierra) what stopped them. Not that you have to, but I thought it curious to know hikers’ motivations for missing the peak.
- 41.1% – Snow concerns
- 23.4% – Weather
- 19.4% – Already summited (another time)
- 15.3% – Didn’t want to devote extra time
- 9.7% – Personal/logistical
- 8.5% – Not enough food
- 7.7% – No interest in summiting
- 6.9% – Behind schedule
- 5.6% – Altitude issues
- 4.0% – Hiking partner didn’t want to
- 3.6% – Injury
- 1.6% – Illness
- 1.6% – Wanted to stay with friends
Hiker Challenges
The Pacific Crest Trail can be a challenging place for hikers. Here, we cover which sections of the trail hikers found most difficult and which sections were considered, by hikers, to be the easiest.
I also ask hikers about their experience in the Sierra. We’ll see which Sierra passes hikers found most challenging, which hikers found to be easiest, and how well hikers coped with various factors, including storms, fires, mosquitoes, and stream crossings.
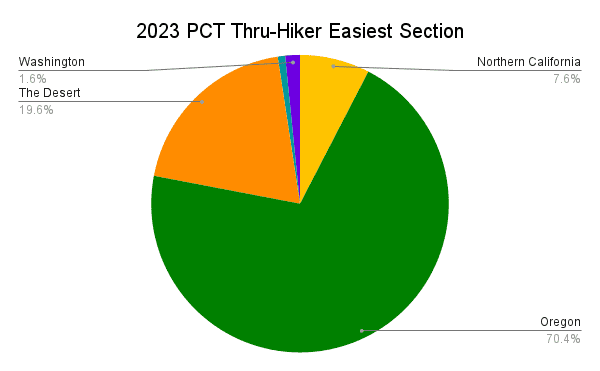
Easiest PCT Section
- 19.6% – The Desert
- 0.8% – The Sierra
- 7.6% – Northern California
- 70.4% – Oregon
- 1.6% – Washington
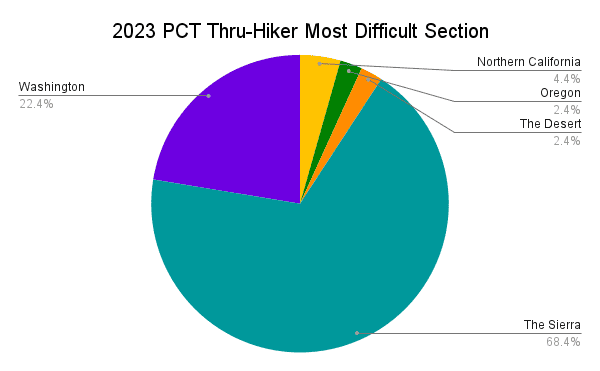
Most Difficult PCT Section
- 2.4% – The Desert
- 68.4% – The Sierra
- 4.4% – Northern California
- 2.4% – Oregon
- 22.4% – Washington
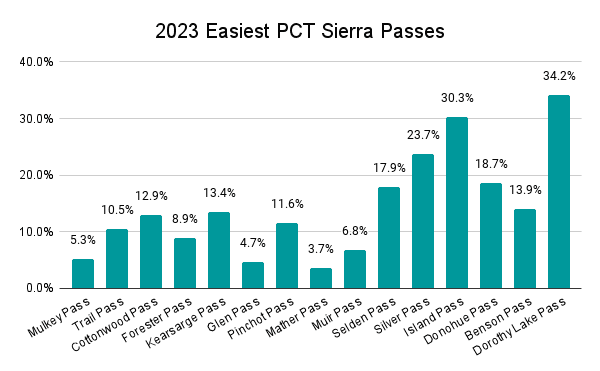
Easiest Sierra Passes
Below are the passes in the Sierra listed from south to north, along with the percentage of hikers who ranked that pass as the easiest.
- 5.3% – Mulkey Pass
- 10.5% – Trail Pass
- 12.9% – Cottonwood Pass
- 8.9% – Forester Pass
- 13.4% – Kearsarge Pass
- 4.7% – Glen Pass
- 11.6% – Pinchot Pass
- 3.7% – Mather Pass
- 6.8% – Muir Pass
- 17.9% – Selden Pass
- 23.7% – Silver Pass
- 30.3% – Island Pass
- 18.7% – Donohue Pass
- 13.9% – Benson Pass
- 34.2% – Dorothy Lake Pass
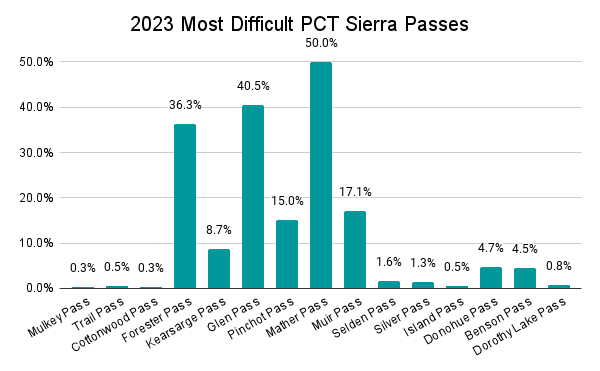
Most Difficult Sierra Passes
Below are the passes in the Sierra listed from south to north, along with the percentage of hikers who ranked that pass as the most challenging.
- 0.3% – Mulkey Pass
- 0.5% – Trail Pass
- 0.3% – Cottonwood Pass
- 36.3% – Forester Pass
- 8.7% – Kearsarge Pass
- 40.5% – Glen Pass
- 15.0% – Pinchot Pass
- 50.0% – Mather Pass
- 17.1% – Muir Pass
- 1.6% – Selden Pass
- 1.3% – Silver Pass
- 0.5% – Island Pass
- 4.7% – Donohue Pass
- 4.5% – Benson Pass
- 0.8% – Dorothy Lake Pass
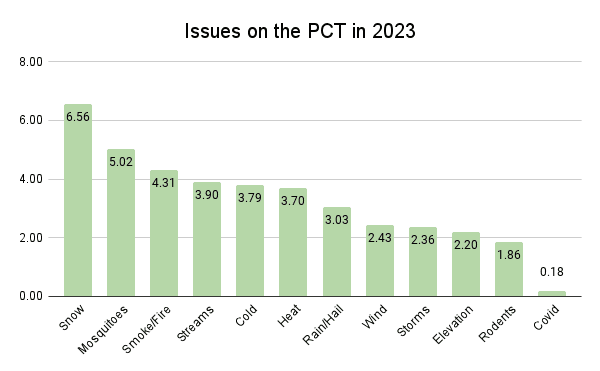
On-Trail Issues
On a scale of 1 to 10, I asked hikers how much of an issue each of the following was during their hikes. Here are the averages from thru-hikers who finished.
- 6.56 – Snow
- 5.02 – Mosquitoes
- 4.31 – Smoke/Fire
- 3.90 – Streams
- 3.79 – Cold
- 3.70 – Heat
- 3.03 – Rain/Hail
- 2.43 – Wind
- 2.36 – Storms
- 2.20 – Elevation
- 1.86 – Rodents
- 0.18 – Covid
Why Hikers Didn’t Finish
If you were left wondering what happened to the hikers who didn’t complete the PCT this year when we covered the completion rates above, fear not. Here are the specifics as to why hikers didn’t complete the Pacific Crest Trail.
This section looks at why thru-hikers got off the trail, how those who got off with injuries were injured, where hikers were injured, and how many miles were completed by thru-hikers who ended their hikes early.
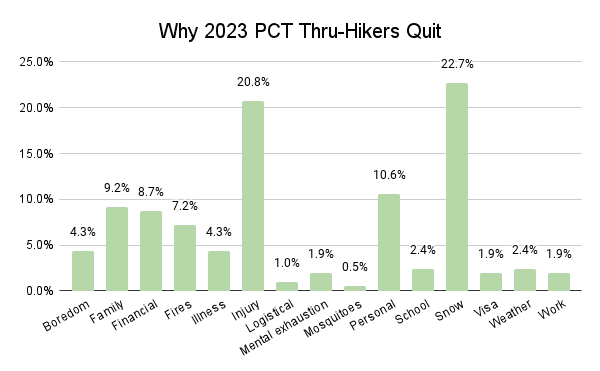
Why Thru-Hikers Quit
- 22.7% – Snow
- 20.8% – Injury
- 10.6% – Personal
- 9.2% – Family
- 8.7% – Financial
- 7.2% – Fires
- 4.3% – Boredom
- 4.3% – Illness
- 2.4% – School
- 2.4% – Weather
- 1.9% – Mental exhaustion
- 1.9% – Visa
- 1.9% – Work
- 1.0% – Logistical
- 0.5% – Mosquitoes
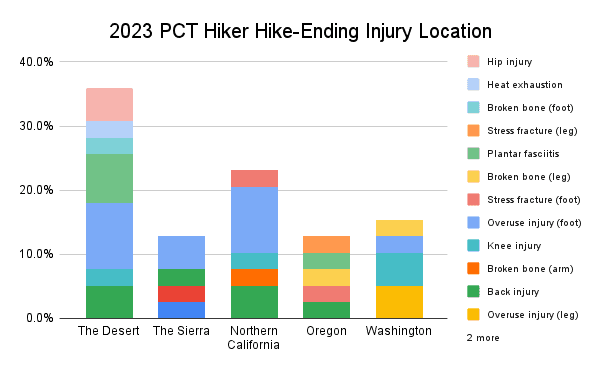
Hike-Ending Injury Breakdown
Injury is a big killer of thru-hikes and is typically something hikers can exercise some control over (as opposed to fires that can flare up seemingly without warning). Here, we break down what kinds of injuries ended hikes and where these hike-ending injuries occurred.
Hike-Ending Injuries
- 28.2% – Overuse injury (foot)
- 15.4% – Back injury
- 10.3% – Knee injury
- 10.3% – Plantar fasciitis
- 5.1% – Stress fracture (foot)
- 5.1% – Broken bone (leg)
- 5.1% – Hip injury
- 5.1% – Overuse injury (leg)
- 2.6% – Broken bone (arm)
- 2.6% – Stress fracture (leg)
- 2.6% – Broken bone (foot)
- 2.6% – Heat exhaustion
- 2.6% – Heart issues
- 2.6% – Shin splints
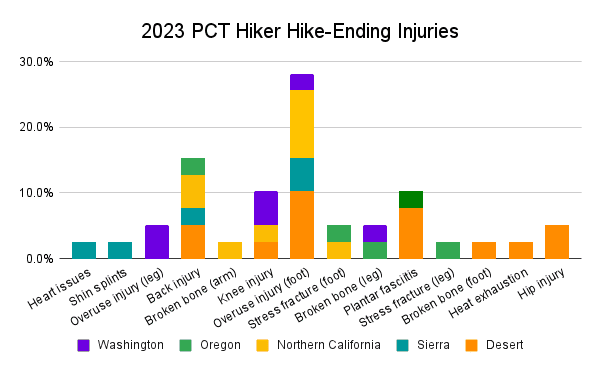
Where Injuries Occurred
- 35.9% – The Desert
- 12.8% – The Sierra
- 23.1% – Northern California
- 12.8% – Oregon
- 15.4% – Washington
Miles Completed by Hikers
This information reflects the miles completed by hikers who did not complete the Pacific Crest Trail.
- 2.4% – < 100 mi
- 5.4% – 100 – 200 mi
- 6.8% – 250 – 500 mi
- 9.8% – 500 – 750 mi
- 10.2% – 750 – 1000 mi
- 7.8% – 1000 – 1250 mi
- 7.8% – 1250 – 1500 mi
- 7.8% – 1500 – 1750 mi
- 19.5% – 1750 – 2000 mi
- 14.1% – 2000 – 2250 mi
- 8.3% – 2250+ mi
Average: 1,396 mi / 2,247 km
Median: 1,500 mi / 2,414 km
σ = 708 mi / 1,139 km

Resupply
The word resupply can be anxiety-inducing if you’re new to the idea of long-distance thru-hiking. What is resupply? Where does it come from? How much of it is there? How do you get it? Will it hurt?
Resupply is getting yourself more food to power more hiking. It need not be scary or intimidating. Pacific Crest Trail resupply has become simpler over the years, but when and where hikers resupply is still a question that many find overwhelming.
Here we have this year’s resupply stats, resupply strategy/boxes, resupply box suggestions, hitchhiking difficulties, where hikers resupplied, favorite and least favorite resupply stops, favorite meals and snacks, and resupply advice.
PCT Resupply Stats
Thru-Hikers (1)
29
The average number of resupplies over the entire trail
(M = 29 | σ = 7.7)
Thru-Hikers (1)
5.9
The average number of days between resupplies
(M = 5.3 | σ = 2.1)
Thru-Hikers (1)
100.3
The average number of miles between resupplies (161.4 km)
(M = 92 mi / 148 km | σ = 35 mi / 56 km)
Thru-Hikers
3.2
The average number of resupply boxes prepared ahead of time
(M = 1 | σ = 5.5)
Thru-Hikers (1)
8.5
The average total number of resupply boxes sent
(M = 7 | σ = 6)
Thru-Hikers (1)
24%
The average percent of resupplies sent as boxes
(M = 20% | σ = 23%)
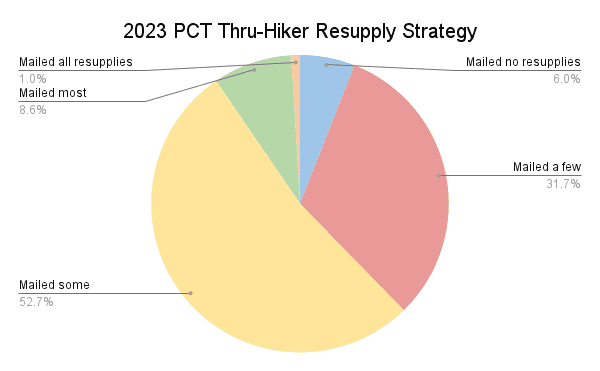
Resupply Strategy
- 1.0% – Mailed all resupplies
- 8.6% – Mailed most resupplies (> 50%)
- 52.7% – Mailed some resupplies (10-50%)
- 31.7% – Mailed a few resupplies (1-10%)
- 6.0% – Mailed no resupplies
Many prospective PCT thru-hikers are incredibly concerned about resupply – but take a breath. Remember, you can mail yourself boxes from on the trail. You do not have to prepare all your resupply boxes (or resupply locations) beforehand. Many towns have supermarkets (and post offices).
That said, it can be helpful (and time-saving) to mail yourself resupply boxes. Hikers may choose this option because of a resupply stop’s limited food selection, dietary restrictions, high prices, or even the owners of the local resupply establishment being awful people (that said, most are lovely).
Something else to consider when considering resupply is that many towns along the PCT are only accessible via car (or ludicrously long, dangerous, and ill-advised road walks). How do you get to these towns? Many hikers elect to hitchhike.
Here are the places where hikers recommend sending a resupply box and where they had difficulty hitchhiking to/from.
Suggest Mailing Resupply
- Stehekin (Washington) 69.2%
- Crater Lake National Park (Oregon) 40.7%
- Kennedy Meadows* (Sierra) 39.5%
- Shelter Cove Resort (Oregon) 39.5%
- Snoqualmie Pass (Washington) 34.0%
- White Pass (Washington) 31.8%
- Stevens Pass/Skykomish (Washington) 27.3%
- Hikertown (Desert) 21.9%
- Seiad Valley (Northern California) 17.9%
- Kennedy Meadows North (Northern California) 17.4%
*Kennedy Meadows is where most northbound hikers begin carrying bear canisters. What is the most popular bear canister from this year? (And every year.) The BV500. I’m a fan of the BV450, but more on that in the gear guide.
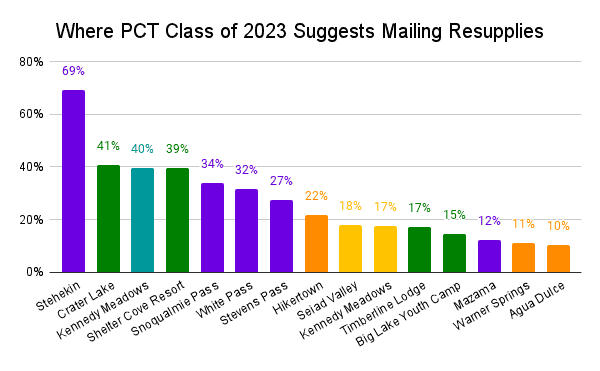
Note: 8.1% of thru-hikers (1) suggest mailing zero resupply boxes.
Difficult Hitches
- Etna (Northern California) 7.4%
- Leavenworth (Washington) 6.2%
- Wee Vill Market (Desert) 5.4%
- Kennedy Meadows North (Northern California) 4.7%
- Lone Pine (Sierra) 4.7%
- Chester (Northern California) 4.5%
- Bend (Oregon) 4.2%
- Cabazon (Desert) 4.0%
- Stevens Pass/Skykomish (Washington) 3.7%
- Bishop (Sierra) 3.5%
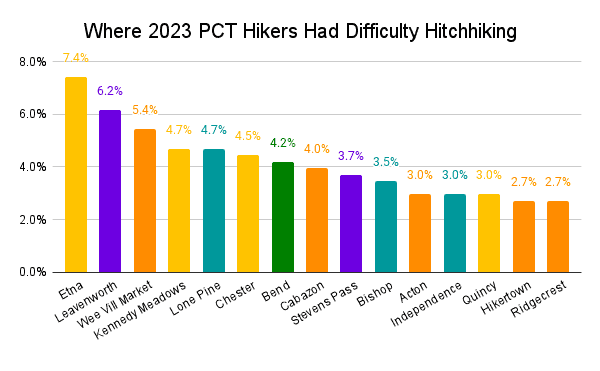
Note: 52.2% of thru-hikers (1) didn’t have trouble hitchhiking, and 0.5% did not hitchhike.
Where Hikers Resupplied
I ask hikers to report where they resupplied – not where they stopped/passed through, but where they purchased, picked up, were given, or otherwise came into a new food stock. For example, the trail passes through the middle of Agua Dulce; theoretically, all thru-hikers who complete the trail will go there, but not all thru-hikers resupply there. Make sense? I hope so. You’ll have issues on the trail if you’re struggling with this.
Locations are listed in geographical order from Mexico to Canada (that’s south to north), and again, I use the following colors to indicate each resupply stop’s popularity: over 75%, 50-75%, 25-50%, and below 25%.
Desert Resupply
- ⛺ Campo – 13.4%
- ⛺ Lake Morena – 15.9%
- ⛺ Mount Laguna – 47.0%
- Julian – 78.4%
- Ranchita BODEGA (formerly Montezuma Valley Market)- 36.4%
- ⛺ Warner Springs – 41.4%
- ⛺ Paradise Cafe – 13.2%
- Anza – 1.1%
- ⛺ Idyllwild – 91.8%
- Cabazon – 32.9%
- Banning – 16.6%
- Palm Springs – 5.7%
- Alpine Village Inn – 0.2%
- ⛺ Cajon Pass – 22.3%
- Big Bear City – 36.4%
- Big Bear Lake – 61.4%
- Wrightwood – 89.5%
- ⛺ Acton KOA – 25.0%
- Acton – 38.6%
- ⛺ Agua Dulce -35.5%
- Palmdale – 5.4%
- Lancaster – 4.3%
- ⛺✉️ Hikertown -32.1%
- Wee Vill Market -35.0%
- Tehachapi – 94.3%
- Mojave – 2.1%
- Onyx – 0.4%
- Lake Isabella – 15.0%
- Kernville – 2.1%
- Ridgecrest – 38.9%
Sierra Resupply
- ⛺✉️ Kennedy Meadows* – 58.2%*
- Grumpy Bears Retreat – 10.3%*
- Triple Crown Outfitters – 45.7%*
- Lone Pine via Horseshoe Meadow – 26.2%
- Independence via Horseshoe Meadow – 1.1%
- Bishop via Horseshoe Meadow – 8.1%
- Lone Pine via Kearsarge Pass/Onion Valley – 7.8%
- Independence via Kearsarge Pass/Onion Valley – 8.1%
- Bishop via Kearsarge Pass/Onion Valley – 55.2%
- Muir Trail Ranch – 10.6%
- Bishop via Bishop Pass/South Lake – 33.2%
- Bishop via Piute Pass/North Lake – 7.5%
- Vermilion Valley Resort (VVR) – 21.5%
- ⛺ Red’s Meadow – 8.1%
- Mammoth Lakes – 77.7%
- ⛺ Tuolumne Meadows – 3.3%
- Yosemite Valley – 27.3%
- Lee Vining – 3.9%
- Bridgeport – 3.6%
- Kennedy Meadows North – 78.6%
- Pinecrest – 7.8%
- Strawberry – 1.7%
- Markleeville – 1.7%
*All these locations are located in Kennedy Meadows (South) – at the same point in the PCT
Northern California Resupply
- ⛺ Echo Lake – 3.2%
- South Lake Tahoe – 83.3%
- Stateline – 0.3%
- Sacramento – 1.6%
- Tahoe City – 2.4%
- Soda Springs – 3.2%
- Truckee – 45.0%
- Reno – 8.8%
- ⛺ Sierra City – 70.0%
- Quincy – 48.5%
- Chico – 1.3%
- Chester – 75.6%
- Bucks Lake – 10.3%
- Caribou Crossroads – 0.3%
- ⛺ Belden – 19.4%
- Redding – 2.4%
- ⛺ Old Station – 30.5%
- ⛺ Burney Falls – 9.8%
- Burney – 70.6%
- ⛺ Castella – 7.7%
- Dunsmuir – 30.0%
- Mount Shasta – 62.3%
- Regeneration Base Camp – 0.8%
- Etna – 79.8%
- ⛺ Seiad Valley – 64.2%
Oregon Resupply
- ⛺ Callahan’s – 7.7%
- Ashland – 81.9%
- ⛺ Hyatt Lake Resort – 3.5%
- Medford – 9.8%
- ⛺ Fish Lake Resort – 15.5%
- ⛺ Lake of the Woods Resort – 2.4%
- ⛺✉️ Crater Lake (Mazama Village) – 86.3%
- ⛺ Diamond Lake Resort – 4.1%
- Chemult – 2.0%
- ⛺✉️ Shelter Cove Resort – 73.4%
- Odell Lake Resort – 3.5%
- ⛺ Elk Lake Resort – 14.0%
- Eugene – 1.8%
- Sisters – 18.1%
- Bend – 62.3%
- ⛺ Big Lake Youth Camp – 23.6%
- ⛺ Olallie Lake Resort – 22.0%
- Salem – 0.4%
- ⛺ Government Camp – 14.5%
- ⛺ Timberline Lodge – 39.7%
- ⛺ Cascade Locks – 58.9%
- Hood River – 27.1%
- Portland – 15.9%
Washington Resupply
- Trout Lake – 76.5%
- ⛺✉️ White Pass – 76.7%
- Packwood – 12.7%
- ⛺✉️ Snoqualmie Pass – 86.8%
- ⛺✉️ Stevens Pass – 51.6%
- Skykomish – 17.5%
- Seattle – 11.7%
- Monroe – 0.4%
- Wenatchee – 6.9%
- Leavenworth – 55.3%
- Chelan – 3.4%
- ⛺✉️ Stehekin – 76.9%
- Winthrop – 5.0%
- Mazama – 30.2%
✉️ Stops where this year’s class suggests sending resupply boxes to
⛺ Stops that can be reached without hitchhiking (either on the trail or a relatively short detour)
Favorite & Least Favorite Resupply Stops
Now we know the most popular stops for resupplying and for sending resupply boxes, but what about hikers’ favorite and least favorite resupply stops? When asking this question, I specify, “‘Favorite/Least Favorite’ means where you most/least enjoyed, not where had the best/worst resupply options (although these could be the same).”
Favorite Resupply Stop
Idyllwild, CA
Desert (50.7%)
Least Favorite Resupply Stop
Hikertown, CA
Desert (20.7%)
Favorite Resupply Stops
- Desert: Idyllwild (50.7%)
- Sierra: Bishop (49.0%)
- Northern California: Etna (33.4%)
- Oregon: Ashland (46.3%)
- Washington: Stehekin (27.1%)
Runners-Up
- Desert: Wrightwood (38.0%)
- Sierra: Kennedy Meadows (23.4%)
- Northern California: Mount Shasta (20.2%)
- Oregon: Bend (38.5%)
- Washington: Leavenworth (25.1%)
Least Favorite Resupply Stops
- Desert: Hikertown (20.7%)
- Sierra: Grumpy Bears Retreat (6.6%)
- Northern California: Kennedy Meadows North (12.5%)
- Oregon: Crater Lake National Park (10.3%)
- Washington: Snoqualmie Pass (9.0%)
Runners-Up
- Desert: Cabazon (14.1%)
- Sierra: Independence (3.2%)
- Northern California: Chester (8.8%)
- Oregon: Shelter Cove Resort (8.8%)
- Washington: White Pass (6.4%)
Dietary Restrictions, Meals, and Snacks
For the final piece of the resupply puzzle, we take a look at hiker dietary restrictions, how easy they found resupplying with these restrictions, and which meals and backpacking snacks hikers enjoyed most out on the PCT. More on this is to come in the PCT Resupply Guide.
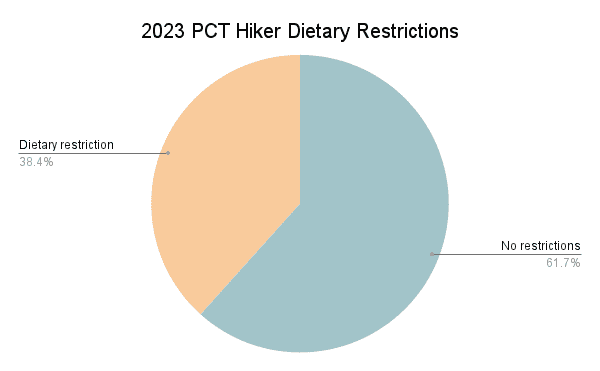
Dietary Restrictions
- 38.4% Yes
- 61.7% No
Specific Dietary Restrictions
- 46.9% – Vegetarian
- 17.5% – Dairy-free
- 15.5% – Vegan
- 12.4% – Beef-free
- 11.3% – Pescatarian
- 9.3% – Gluten-free
- 7.2% – Peanut allergy
- 4.1% – Tree-nut allergy
- 1.5% – Keto
- 1.0% – Diabetic
- 0.5% – Kosher
- 6.2% – Other

Note: These percentages are of hikers with dietary restrictions.
Favorite Backpacking Meals
- Peak Refuel Meals 32.3%
- Knorr Rice Sides 29.1%
- Backpackers Pantry Meals 25.2%
- Mountain House Meals 23.1%
- Good To-Go Meals 14.9%
- AlpineAire Foods 8.0%
- Patagonia Provisions 4.8%
- Greenbelly Meals 3.8%
- Heather’s Choice 3.6%
- Fernweh Food Company (out of business 😞)

Favorite Backpacking Snacks
- M&M’s 35.2%
- Snickers Bars 31.9%
- Potato Chips 29.5%
- Lenny & Larry’s Complete Cookies 26.6%
- Peanut Butter 26.1%
- Trail Mix 21.5%
- Clif Bars 19.4%
- Natures Bakery Fig Bars 18.4%
- Pop-Tarts 17.8%
- Bobos Oat Bars 19.3%

Resupply Changes
Hindsight is 20/20 (unless you’re looking back through the darkness for that mountain lion you think might be following you – that’s probably a deer).
Here is what hikers said they would change about their resupply strategies if they could do it all over again. These don’t change much yearly, so I highly encourage you to heed this advice when considering your resupply options.
This year, 66% of hikers say they would have changed their resupply strategy. Here are the most popular changes hikers would have made to their PCT resupply.
Percentages are of the 66% of hikers who would have changed something – not of all hikers.
- Send more variety in boxes – 24.7%
- Send fewer resupply boxes* – 22.9%
- Send boxes from on trail instead of ahead of time – 21.1%
- Send more resupply boxes** – 19.5%
- Send healthier food in boxes – 18.4%
- Send less food in boxes – 16.8%
- Resupply more frequently – 10.5%
*The average number of boxes sent by hikers who said they would have liked to have sent fewer boxes was 8.4. The overall average was 7.9.
**The average number of boxes sent by hikers who said they would have liked to have sent more boxes was 7.7. The overall average was 7.9.
Thru-Hikers
9.6%
The number of thru-hikers who went stoveless for the entirety of their hikes.
I’ll follow up on this post with a more detailed breakdown of this year’s resupply. Check out the most recent PCT Resupply Guide here. Find all PCT Resupply posts here.
Thru-Hiking Gear
Potentially, what Pacific Crest Trail hikers spend the most time obsessing over before (and on…and after) the trail is their thru-hiking gear. Gear choices play an essential role in a thru-hike, but no magical gear combination guarantees you a successful thru-hike (if you know otherwise, please let me know).
I do a deep dive into gear used by PCT hikers in my PCT Gear Guide, but here’s a taste of what to expect.
Thru-Hikers
18.3 lbs
Average pre-hike base weight (8.30 kg)
(M = 17 lbs / 7.71 kg | σ = 7.1 lbs / 3.22 kg)
Thru-Hikers (1)
16.3 lbs
Average post-hike base weight (7.39 kg)
(M = 15 lbs / 6.80 kg | σ = 5.7 lbs / 2.59 kg)
Thru-Hikers (1)
-1.6 lbs
Average total change in base weight (726 g)
(M = 1 lb / 454 g)
Thru-Hikers
54.6 L
Average backpack size
(M = 55)
Thru-Hikers
17.5°F
Average sleeping bag rating (-8.06°C)
(M = 20°F / -6.67°C)
Thru-Hikers (1)
4.8
Average total number of shoes used
(M = 5)
This information is covered in more detail in the PCT Gear Guide based on PCT Survey data.
Let’s take a peek at some of the gear thru-hikers were using on the trail this year. Here are the most common “Big 4” items: packs, shelters, sleeping bags, and sleeping pads (I know it’s the “Big 3”, but I include sleeping pads, get over it) along with the most common insulated jackets and shells.
Remember, this is simply the most common gear PCT hikers use – not necessarily the best (although it’s entirely possible these are the same). I will provide breakdowns of the highest-rated gear (in addition to the most common) in the upcoming PCT Gear Guide.
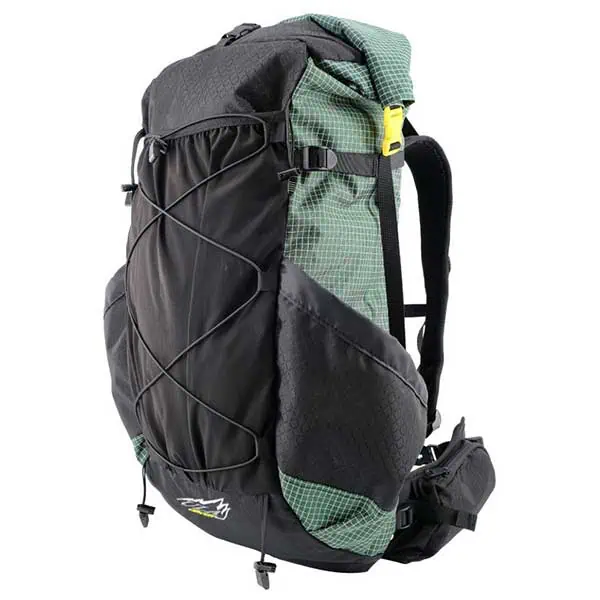
Most Common PCT Backpacks
- ULA Circuit
- Hyperlite Mountain Gear Southwest*
- Gossamer Gear Mariposa
- Osprey Exos**
- Hyperlite Mountain Gear Junction*
- Atom Packs Prospector
- Durston Gear Kakwa
- Zpacks Arc Haul
- ULA Catalyst
- Osprey Eja**
*The Hyperlite Mountain Gear Southwest and Junction are the same pack but with different exterior pocket materials.
**The Osprey Exos and the Osprey Eja are the men’s and women’s versions of the same pack.
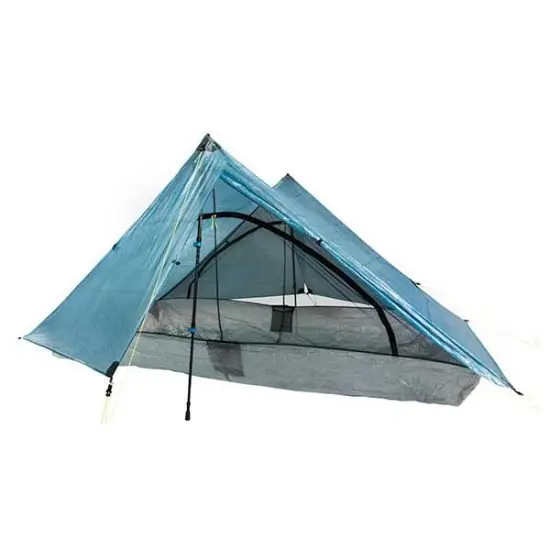
Most Common PCT Shelters
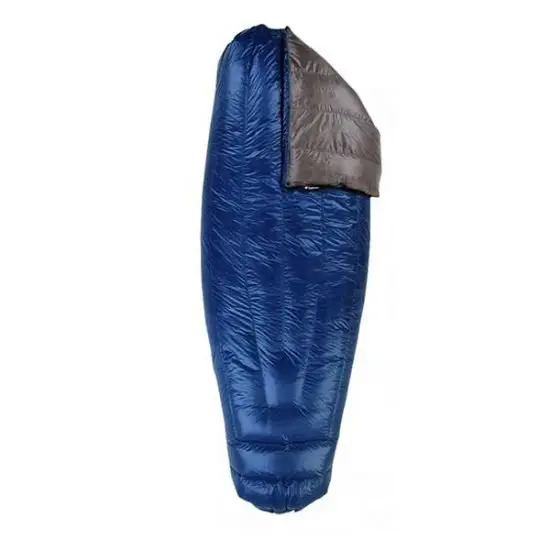
Most Common PCT Sleeping Bags/Quilts
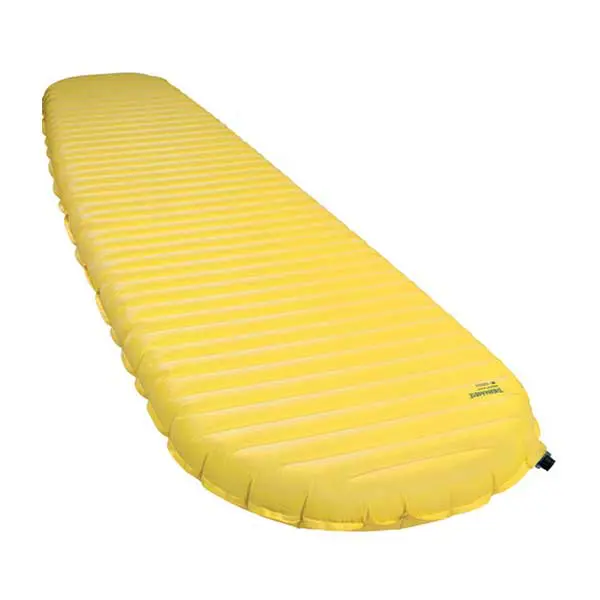
Most Common PCT Sleeping Pads
- Therm-a-Rest NeoAir XLite NXT
- NEMO Equipment Tensor
- Therm-a-Rest NeoAir XLite – Women’s (discontinued)
- Therm-a-Rest NeoAir XTherm NXT
- NEMO Equipment Switchback
- Therm-a-Rest Z Lite Sol
- Sea to Summit UltraLight Insulated
- Therm-a-Rest NeoAir UberLite
- Big Agnes Rapide SL (discontinued)
- Therm-a-Rest NeoAir XLite NXT (Short)
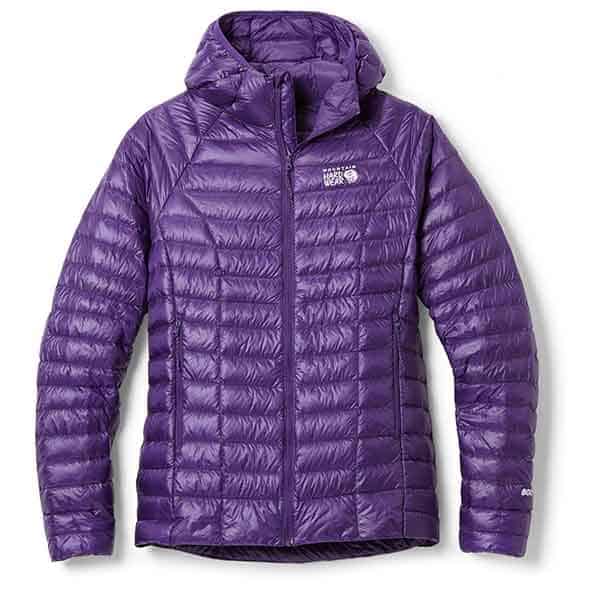
Most Common PCT Insulated Jackets
- Mountain Hardwear Ghost Whisperer/2 Hoody (Men’s/Women’s)
- Enlightened Equipment Torrid (Men’s/Women’s)
- Patagonia Micro Puff Hoody (Men’s/Women’s)
- Decathlon Forclaz Trek 100 (Men’s/Women’s)
- Patagonia Nano Puff Hoody (Men’s/Women’s)
- Mountain Hardwear Ghost Whisperer UL Hoody (Men’s/Women’s)
- Patagonia Micro Puff Jacket (Men’s/Women’s)
- Patagonia Nano Puff Jacket (Men’s/Women’s)
- Patagonia Down Sweater (Men’s/Women’s)
- Rab Microlight Alpine Jacket (Men’s/Women’s)
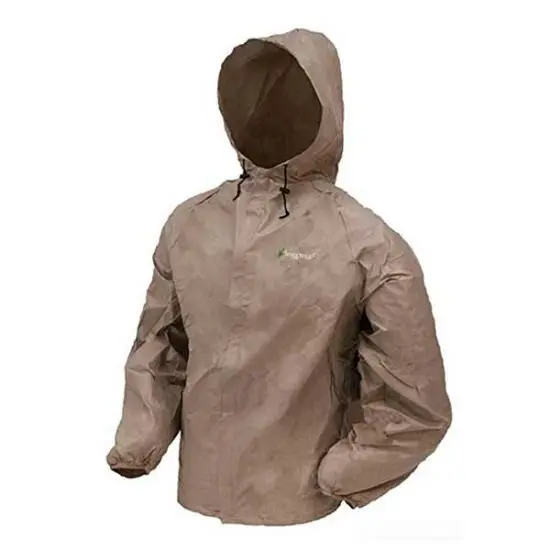
Most Common PCT Shells
- Frogg Toggs Ultra-Lite Rain Suit (Men’s/Women’s)
- Outdoor Research Helium (Men’s/Women’s)
- Montbell Versalite (Men’s/Women’s)
- Patagonia Torrentshell 3L (Men’s/Women’s)
- Lightheart Gear Rain Jacket
- Arc’teryx Beta Jacket (Men’s/Women’s)
- Marmot PreCip Eco (Men’s/Women’s)
- Zpacks Vertice (Men’s/Women’s
- Frogg Toggs Xtreme Lite (Men’s/Women’s)
- Black Diamond StormLine Stretch (Men’s/Women’s)
This is just the tip of the proverbial thru-hiking gear iceberg. As mentioned above, I will publish a detailed breakdown of this year’s PCT gear. This will include water treatment, stoves, fleeces, bear canisters, satellite messengers, fitness trackers, snow gear, hiking tops, shoes, and so-called luxury items.
This will also include a look at what hikers didn’t like about their gear, what gear decisions (might have) helped hikers to a successful thru-hike, how hikers would change/adapt their gear for a future hike, and more. I will also publish a women-specific gear post and a couples-specific gear post.
For more gear, check out the Ultimate Pacific Crest Trail Packing List.
Technology on Trail
Gone are the days of the Pacific Crest Trail old when it was a trail sought out by only uber-experienced backcountry orienteers; thanks to the magic of technology, any dodo can grab a phone and have a reasonably good chance of not killing themselves on the trail.
Phones are everywhere on the trail. If the sight of a cellular device in the wilderness distresses you, then prepare yourself. Phones are hikers’ cameras, GPS devices, televisions, music players, town-researching devices, and (sometimes) SOS devices (that said, I suggest a Garmin inReach Mini 2 if you’re looking for a satellite messenger with SOS capabilities).
There are several apps commonly used by Pacific Crest Trail hikers – and even one designed specifically for the PCT (that you should most certainly invest in). Here are the apps and phones hikers were using out on the trail this year.
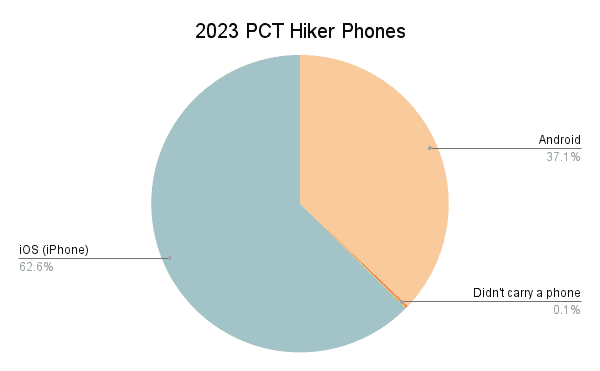
PCT Hiker Phones
- 62.6% iPhone
- 37.1% Android
- 0.1% Other
- 0.1% Didn’t carry a phone
PCT Hiker Apps
- 97.9% – FarOut Guides
- 30.8% – Gaia GPS
- 33.8% – Garmin Explore
- 15.0% – Peak Finder
- 8.0% – Strava
- 6.4% – Seek by iNaturalist
- 6.2% – CalTopo
- 3.5% – Merlin Bird ID
- 2.7% – Avenza Maps
- 1.9% – Mapy.cz
- 1.5% – AllTrails
- 1.2% – MAPS.ME
- 0.9% – Hiker’s Logbook
- 0.8% – OnX Backcountry
- 0.8% – OsmAnd
- 0.8% – Google Maps
- 0.5% – Watch Duty
- 0.4% Locus Maps
- 0.3% Hiiker
- 0.1% Backcountry Navigator
- 0.7% Didn’t use apps

Hiker Health & Water Sources
Water treatment and personal hygiene are (or should be) big considerations for hikers. Typically, thru-hikers worry less about these as the trail goes on, but experience isn’t always your friend.
Some hikers religiously filter all water that passes through their face hole – it doesn’t matter if it comes out of a hotel sink or a puddle with a cow pooping in it. Other hikers will “not filter in the Sierra,” “not filter above 10,000 ft / 3,048 m”, or “not filter running water” (this last one is not a good idea – running water can 100% get you sick).
Everyone wants to look cool in front of their friends by not filtering water (note: not filtering your water does not make you cool), but there are risks to the badass thru-hiker lifestyle (and drinking dirty, giardia-infested water).
To find out how good a job everyone is doing filtering their water and sanitizing their hands after pooping (another way to get yourself sick), I ask hikers if they got sick (defined as three or more days of digestive issues or diagnosed giardia), how often they treated water sources, and how these two things compare to one another.
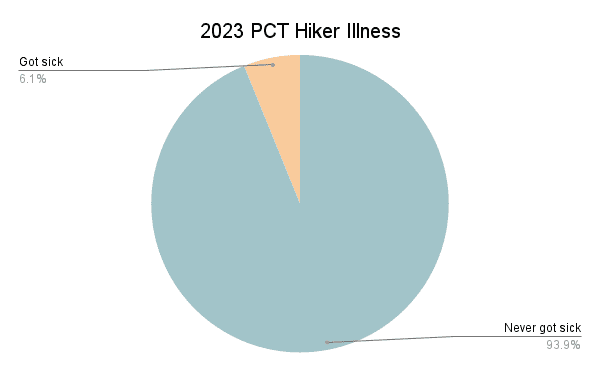
PCT Hiker Illness
- 93.9% Didn’t get sick
- 6.1% Got sick
Water Treatment Frequency
- 76.4% Always
- 16.7% Usually
- 5.7% Sometimes
- 1.2% Never
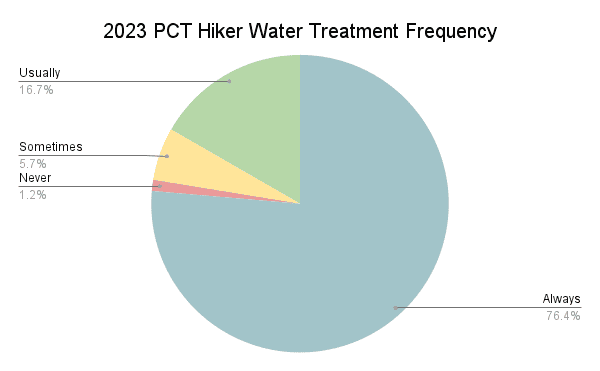
Looking at these two questions together, we can see the following.
- 76.4% of hikers always treated their water, and 5.2% of these hikers got sick
- 16.7% of hikers usually treated their water, and 8.8% of these hikers got sick
- 5.7% of hikers sometimes treated their water, and 11.6% of these hikers got sick
- 1.2% of hikers never treated their water, and 0% of these hikers got sick

A reported 6.1% of hikers came down with something akin to giardia, and 1.2% never filtered. That said, those who don’t filter are typically quite staunch in their commitment to their strategy; read: don’t readily admit to becoming sick from not filtering.
Favorite and Least Favorite Sections
This may come as a shock, but the Pacific Crest Trail is a long hike with a lot to see (mostly bears). Here is a look at hikers’ favorite and least favorite sections.
Favorite PCT Section
- Sierra
- Washington
- Desert
- Northern California
- Oregon

Least Favorite PCT Section
- Northern California
- Oregon
- Desert
- Washington
- Sierra

Favorite Section
Goat Rocks Wilderness
Washington (63.6%)
Least Favorite Section
Southern Oregon
Oregon (51.9%)
Favorites
- Desert: Mount San Jacinto State Park (12.0%)
- Sierra: John Muir Trail (53.6%)
- Northern California: Trinity Alps Wilderness (16.4%)
- Oregon: Crater Lake National Park (18.8%)
- Washington: Goat Rocks Wilderness (63.6%)
Runners-Up
- Desert: The Aqueduct (4.4%)
- Sierra: Kings Canyon National Park (34.8%)
- Northern California: Marble Mountain Wilderness (7.2%)
- Oregon: Three Sisters Wilderness (13.6%)
- Washington: Glacier Peak Wilderness (32.4%)
Least Favorites
- Desert: The Aqueduct (32.4%)
- Sierra: Yosemite National Park (1.2%)
- Northern California: Belden to Burney Falls (43.6%)
- Oregon: Southern Oregon (51.9%)
- Washington: Southern Washington (17.8%)
Runners-Up
- Desert: Mojave/Tehachapi to Walker Pass (23.2%)
- Sierra: Kings Canyon National Park (0.8%)
- Northern California: Beforegon, i.e., the northernmost part of CA (31.1%)
- Oregon: Mount Hood National Forest (3.3%)
- Washington: Glacier Peak Wilderness (2.1%)
Best, Worst, Scariest, and Most Surprising Moments
I will share more of these in future posts, but here are some examples that stood out when I asked hikers about their best moments, worst moments, terrifying moments, and most surprising moments from their thru-hikes.
Best PCT Moments
I asked all survey respondents about their best moments on the Pacific Crest Trail. Below are a select few of the responses. Below are a select few of the responses. These will be covered in more detail in an upcoming post.
- Hitting the terminus was such an incredible moment. After a crazy year, it felt incredible to make it there finally, and I probably saw 50 hikers that day between my walk to and from the terminus, whom I had met on the trail but had not seen in months. It was fun catching up with so many old faces on that last day.
- Reaching the summit of Whitney was a huge highlight (although not technically on the trail). Until then, given everything we’d heard about how hard it would be, I didn’t feel sure I could do the Sierra. On the way to Whitney, my hiking partner and I accidentally took an ice chute directly up (we were the first ones up that day and didn’t realize there were switchbacks and boot track), so we were holding on with our crampons and ice axes. Once we made it up, I was so elated to be alive. We also managed to stay calm under a highly dangerous and stressful situation. The deliriousness and the beautiful views were hugely energizing for me. I realized I could do hard things. I felt like I could handle anything in the Sierra after that. Forester, by comparison, felt totally manageable, and everything else after that was fine as well. Nothing felt insurmountable at that point.
- Seeing Crater Lake for the first time. After so much time in beautiful nature, you sometimes get kinda blind to it, but Crater Lake was so overwhelmingly beautiful that I cried happy tears.
- Watching the sunrise from the summit of Mt. Baden-Powell with 18 other hikers. It was a beautiful moment; sharing it with new friends felt so special.
Worst PCT Moments
I asked all survey respondents about their worst and/or lowest moments on the Pacific Crest Trail. Below are a select few of the responses. Check out this post if you want to read more about hikers’ worst moments on the Pacific Crest Trail.
- The day before Forester, we reached the last river crossing quite late. It was getting dark, and we hiked over a mile upstream in the snow until we found a spot. I could not feel my feet for an hour after crossing. We camped on the other side on a stoney patch. It was super windy, and my tent stakes didn’t hold. I got out to fix them three times; on the 4th time, the tent blew over me so aggressively that I was burritoed in the mesh and just tried to sleep that way.
- Going through Glacier Peak Wilderness, my body was giving out, my feet were in more pain than ever before, and I was extremely stressed about the upcoming fire closure. I was only a week from the finish, but I was worried that I wouldn’t even make it.
- I had to get off the trail early on (Big Bear) for nine days due to a foot injury. I had a pain in my second toe that had kept getting slowly worse over the last five days, and I thought it might be a stress fracture. I ended up having an inflamed tendon in my toe. Facing the uncertainty and possible disappointment of getting off the trail early was brutal—no one in my trail family had gotten off, so I felt completely alone with no one to relate to.
- When my tramily began to leave me behind in the desert because I had a knee injury and could not keep up. I would push myself as far as I could and be so proud of myself, and then they would all go three more miles than me. They eventually left me behind completely.
Scariest PCT Moments
I asked all survey respondents about their scariest moments on the Pacific Crest Trail (or when they felt the most unsafe). Below are a select few of the responses. If you want to read more about hikers’ scariest moments on the Pacific Crest Trail, check out this post.
- I had to turn around close to the Oregon/California border because of the fires and hiked until late at night to get closer to the road. I slept a couple of hours with only the essentials in my backpack (passport, some water, phone, and PLB) in case I needed to abandon my tent and run away at night.
- I felt like I was going to die trying to run across the highway in Cajon Pass to get to the motel. We walked through the wash instead; IRL Frogger felt too sketchy.
- When my friends and I were trying to hitch from a gas station to Bend, Oregon, a man with a gun threatened to shoot us if we continued to try to hitch there.
- After summiting Baden-Powell, I took the wrong alternate down and regretted it about an hour later. Before then, I couldn’t see the point of an SOS device, but I ordered a Garmin shortly after because it felt unsafe.
PCT Surprises
I asked all survey respondents about the things or moments that surprised them most about the Pacific Crest Trail. Below are a select few of the responses. These will be covered in more detail in an upcoming post.
- For some reason I didn’t realize I‘d be in actual mountains the majority of the time; the extent of just how wild and adventurous everything would be; the generosity and willingness to help of trail angels and strangers; how raw and unmasked everyone on trail was and how close you grow to people within just days.
- How subtly you build conditioning and start crunching big days back-to-back.
- I didn’t realize how difficult the terrain would be. I was prepared for elevation but not for the terrain itself. Lava is evil. I did not expect to enjoy the town stops as much as I did; I am very much an introvert and was dreading the town stops the most, but some of my best memories were there.
- You’re still sore all the time – even at the end.
The Pacific Crest Trail is, for the most part, an amazing place filled with incredible people.
However, just as the trail itself can be not so amazing at times – thunderstorms, fires, horrific weather events – the people, too, can occasionally be awful on the PCT.
There will be an upcoming article covering social issues on the trail in more detail.

Ageism
Overall, 12.5% of hikers experienced ageism on the Pacific Crest Trail. 8.7% experienced ageism from other hikers, 1.0% from people in town, and 2.8% from both their fellow hikers and people in town.
*As ageism was reported by hikers with a wide variety of ages, these percentages encompass all hikers.
Homophobia/Transphobia
Overall, 42.4% of LGBTQIA+ hikers experienced homophobia or transphobia on the Pacific Crest Trail. 9.6% experienced homophobia or transphobia from other hikers, 22.4% from people in town, and 10.4% from both their fellow hikers and people in town.
Racism
Overall, 22.5% of BIPOC hikers experienced racism on the Pacific Crest Trail. 1.3% experienced racism from other hikers, 17.5% from people in town, and 3.8% from both their fellow hikers and people in town.
Sexism
Overall, 53.1% of women experienced sexism or sexual harassment on the Pacific Crest Trail. 12.8% experienced sexism or sexual harassment from other hikers, 15.4% from people in town, and 2.94% from both their fellow hikers and people in town.
Trail Magic
Trail angels can be a tricky bunch. Sadly, there are trail angels who are likely responsible for some of the behavior in the above section. However, many (I would hope most) trail angels are well-meaning folks out to help hikers.
I asked hikers about the frequency with which they encountered or received trail magic. This could mean a friendly person on the trail sharing some fresh fruit with them or a trail angel hanging out at a trailhead giving cold drinks and rides to hikers.
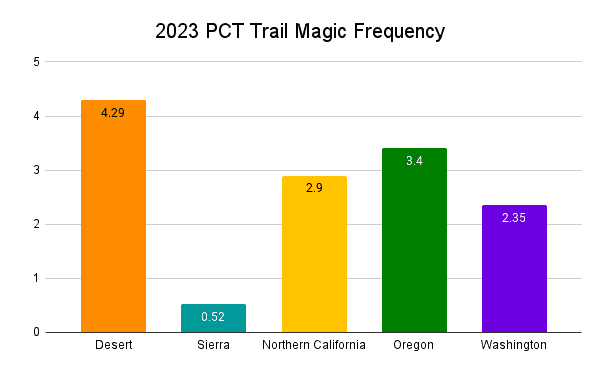
Hikers reported, for each section, how often they encountered trail magic on a scale of 1 (never) to 10 (every day).
- 4.29 – Desert
- 0.52 – Sierra
- 2.90 – Northern California
- 3.40 – Oregon
- 2.35 – Washington
For more on the thru-hiker/trail angel relationship, I suggest the following:
Advice for the Future
Now for Pacific Crest Trail thru-hiker wisdom. I ask hikers what they would have done differently before their hikes if they were to do it all over again.
Pre-Hike Changes
- 24.9% – Saved more money
- 24.9% – Trained more/gotten in better shape
- 24.6% – Gotten base weight down/bought lighter gear
- 14.2% – Had gear more dialed in
- 13.4% – Done more practice hikes
- 12.3% – Planned less
- 12.0% – Started earlier
- 8.7% – Started later
- 4.4% – Planned more
Thru-Hikers
21.62 lbs
The average base weight of hikers who said they would have liked to have gotten lighter gear before starting their hikes (9.807 kg)
In addition to asking hikers what they would have done differently before their thru-hikes, I asked them what they wished they had done differently during their hikes. Here are the top responses (regrets):
During Hike Changes
- 51.1% – More pictures of people
- 24.4% – Fewer zero days
- 22.8% – Maintained a journal/blog
- 16.2% – Slowed down
- 14.2% – More trail zeros
- 13.7% – Less time in town
- 11.2% – Sped up
- 5.1% – More zero days
- 4.9% – More time in town
Thru-Hikers (1)
23
The average number of zero days taken by hikers who said they wish they had taken fewer during their thru-hikes
Thru-Hiker Advice
I asked Pacific Crest Trail hikers for their advice for future PCT hikers. An upcoming post will thoroughly document this, but here is a sample.
- There is no point at which you become a thru-hiker. I spent a lot of SoCal not feeling “legit” or feeling like I didn’t belong. The reality is that the moment you begin your hike, you are a thru-hiker.
- Be prepared to change your expectations. And always listen to your feelings/instincts.
- It’ll be ok. It might not be the thru-hike you imagined, but it will be great. Hike your own hike. More than anything, do that. I had to say goodbye to many friends along the way because I wanted to finish this year. They were some of the saddest moments on trail, but I am so happy I could finish my thru. I didn’t listen to other people, and I slowed down when I wanted to start hiking with a trail family and sped up when I knew it was time to get back to my goal.
- Remember that it is just a long holiday; too many people get stressed out and end up not enjoying themselves. Remember why you are here and advocate for yourself; don’t get swept up in what other people want to do.
Animal Sightings
Some data that doesn’t quite fit anywhere else? What kind of wildlife did Pacific Crest Trail hikers see on the trail? The most common animals? Deer. The worst. The rarest of the animal kingdom? Porcupine.
I would wager that some percentage of the 9.9% who reported seeing a mountain lion saw some eyes in the dark that were probably (most certainly) not a mountain lion. Just saying. I’m probably just jealous because the only time I’ve seen one and it was from a car.
- 98.6% – Deer
- 96.4% – Marmot
- 95.7% – Rattlesnake
- 95.4% – Other snake
- 87.7% – Pika
- 86.5% – Grouse
- 83.7% – Bear
- 53.6% – Mountain goat
- 52.4% – Coyote
- 49.8% – Elk
- 39.9% – Owl
- 31.5% – Fox
- 29.8% – Scorpion
- 27.6% – Pine Marten
- 22.1% – Tarantula
- 12.5% – Big horn sheep
- 10.1% – Bobcat
- 9.9% – Mountain lion
- 9.9% – Tortoise
- 9.4% – Skunk
- 3.8% – Porcupine

Support the Survey
Every year, I get a lot of people asking how to support the surveys. Beyond sharing them with your close-knit bubble of weird hiker friends, the best way to support the survey is to contribute via Patreon. You’ll get access to exclusive posts, discount codes, live streams, and super, extra cool stickers so that everyone will know how cool you are.
If you’re not into Patreon, that’s cool; you can Venmo @halfwayanywhere, Cash app $halfwayanywhere, or PayPal moc.erehwynayawflah@tcatnoc
This is not expected. The data collected in the survey will always be free and accessible to everyone who wants/needs it. Your support is much appreciated and helps pay the website (and survey) bills.


Finally, another HUGE THANK YOU to all the hikers who completed this year’s survey, including (but not limited to): 7, 90, 2Beers, 2Shu, 3 Drink, 30 Foot, 4Snaps, 70-lb Hammer, Ace, All In, Alpha, Alpine, Android, Angry Dane, Apollo, Archie, Artemis, Artifact, Atlas, Autruche, Baby Spice, Baby Steps, Back Splash, Backup, Baconator, Bad Frodo, Bag, Balance, Ballerino, Balloons, Bankart, Barilla, Bartender, Baseline, Bear, Bear Claw, Bedrock, Bee, Beer Slide, Beesly, Beetle, Beetle Juice, Berti, Big Beer, Big Berta, Big Dog, Big Milk, Big Papa, Big Red, Bigbird, Biggest Mac, Bilbo, Binks, Bird, Bird Bath, Blaze, Bless, Blur, Bobcat, Boocha, Boom Boom, Bootscoot, Bootylicious, Boss, Boss Lady, Bougie, Boyscout, Brainpain, British Discovery Team, Brother, Bubba, Bubbles, Bucket, Buddy Arrest, Budgie, Buffer, Bug, Bug’s Life, Bushwhack, By The Way, C7, Cake, Calypso, Campo, Candy Man, Captain, Captain America, Care Bear, Casper, Caterpockets, Chameleon, Charm Pony, Chaser, Chatty, Cheese Head, Cheetah, Chef Meat Sticks, Chewy, Chia, Chirp, Chopper, Cinder, Clean Shave, Clutch, Cobbler, Coinflip, Colors, Compass, Conan, Cookie, Cookie Monster, Cool Socks, Cooler Queen, Corgi, Corn Lily, Couscous, Cowboy, Cowboyboy, Coyote, Crash, Cross Country, Crumb, Crumbs, Crush, Cukes, D20, Dad Joke, Daisy, Danger-Zone, Dash, Davy Crockett, Day One, Deathwish, Deetz, Denglish, Desert Moon, Dex, Dilly Dally, Dirty Harry, Disco Daddy, Ditcher, Diviner, Dog, Dora, Double Dare, Double Double (Dubs), Double Tap, Doug, Down Unda, Dozer, Dr. Dynamite Thunderbum, Dr. Paul aka Trail Crew, Drill Bit, Drop, Drummer, Duck, Duck Dynasty, Ducky, Dumpster Fire, Dutch Tin Man, Edible, Eduardo, El Chapo, El Gato, Eleven, Excalibur, Extra, Faith, Fake Snake, Fanboy, Fargo, Farty Poop Face, Feathers, Fenway, Feral Karaoke “Carrot Top”, Fkct, Fastest Known Carrot Top, aka Stick Queen, Fifth Gear, Firefly, Flamethrower, Flamin Hot, Flamingo, Flash, Flipper One, Flo Daddy, Flop, Flowchart, For Sale, Forecast, Forerunner, Found, Frank, French Fry, Frito, Frog Legs, Frogma, Fry Pocket, Full House, Gadget, Gambler, Gandalf, Garbnb, Gavin, Gazelle, Gearbox, Gelly, German Cowboy, Goat, Goblin, Goldilocks, Gonzo, Good Flow, Goofy, Goop, Gourmet, Grandma, Green Thunder, Greyduck, Gringo Loco, Gritty, Gsale, Gummy Bear, Gummy Tummy, Gusher, Half Full, Handroll, Handyman, Happy Hour, Hash, Hatchet!, Headbanger, Hex, Hidea, Highlight, Hiking Viking, Hitch, Hobbit, Hobble-It, Hobo, Holmes, Hot Deal, Hot Hands, Hot Mess, Hot Mom, Hot Pink, Hot Sauce, Hotlips, Huck, Hulk, Hummingbird, Ice Eater, Icetea, Inches, Indy, Inspector, Jack Rabbit, Jack-Jack, Jar Jar, JB, Jiffy Pop!, Jingles, Jiyuu, Johnni, Johnny Condom, Jolly Roger, Jorey, Jug, Jukebox, Junk Rat, Jynx, Karaoke, Kare Bear, Karmma, Kedger, Kefir, Keystone, Kitty Kitty, Kodak, Lab Rat, Landslide, Lap Top, Last Call, Leapfrog, Leggy The One Peel Wonder!, Lens, Leopard, Light Roast, Linebacker, Lingo, Lite Brite, Little Red, Lizard, Loading…, Local, Locomotive, Lookout, Loon, Lost Property (LP), Low Battery, Lucky, Lucky Boy, Ludacris, Lugs, Luke Skywalker, Madness, Madsquatter, Magpie, Mamacita, Mantis, Maple, Maps, Mario, Mayo, Mc Bob, Meemaw Zen Glimmer, Mia, Milkman, Mini Chimi, Mini P, Minstrel, Mister Ed, Mister Siesta, Monkey, Moony, Mountain Chicken, Mousetrap, Mp, Mr. Palo Alto, Mumbles, Munchie, Murphy, Nasty Cheese, Nasty Elija, Nav, Neighbour, Nekkeddave, Nemo, Neon, Neopolitan, Night Rider, Nitro, Nix, No Chill, No Filter, No Shit, No Snow, No Tape, Nono, Nook, Not Dave, Olaf, Old Faithful, Old Yeller, Oopsies, Pacer, Pack Princess, Pajama Blazer, Parfait, Party Trick, Patches, Peaches, Pebbles, Penguin, Pepper, Pepperjack, Piano Man, Pickle Puff, Piecemeal, Pig Pen, Pika, Pilgrim, Pinecone, Pisa, Pit Stop, Pits, Pivot, Pluto, Pneumonia, Polar Bear, Pooh Spade, Popcorn, Poppins, Postal, Postmaster, Potatoes, Pow, Powerhouse, Prefect, Primo, Princess, Princess Leia, Princess Peach, Pristine, Professor, Puffy, Pull Start, Purple, Purple Haze, Push, Quailista, Quaking Leaf, Quarterback, Queen’s Gambit, Quick Oats, Quiet American, Rabbit, Rafael, Ragnar, Rainbow, Ranger, Rango, Rat Tail, Raymond Bomb, Refill, Relentless, Rev, Road Runner, Roadkill, Roadrunner, Rocketgams, Rockstar, Rollercoaster, Roosta, Rooster, Rumor, Rustler, Salt, Sasquatch, Scrambles, Scratch, Sea Gypsy, Second Pudding, See You Later, Serious, Sewer, Shade, Shakes, Shiny, Shipmate, Shopper, Short Cut, Shortcut, Shrek, Siesta, Silky, Silver Lining, Skeletor, Skinny Lizard, Skip, Skittles, Slapshot, Slide, Slingblade, Slingshot, Sloth, Slow Burn, Smiley, Smokey, Smooth, Smunchy, Snacks, Snake Charmer, Snapchat, Snaps, Snapshot, Snooze, Snorlax, Snot Bubbles, Snow Angel, Snow Leopard, Snow White, Snowmobile “Snowmo”, Soggy, Solo, Sorry, Soup Kitchen, Spanish Inquisition, Sparrow, Speedy Gonzalas, Ten Outta Ten, Speedy Gonzales, Spices, Spigot, Spitfire, Splinter, Spongebob Squarehands, Sprinter, Squeeze, Squid, Squirrel, Stagecoach, Stakes, Starfish, Stats, Steely Dan, Steller’s Jay, Sticks, Sticks And Stones, Stirfry, Stitches, Stoat, Stonehenge, Stop & Go, Storyteller, Storytime, Straggler, Strictly Business, Strider, Strike, Stumpy, Sugar Daddy, Sun Struck, Sunbear, Sundial, Sunflower, Sunglasses, Sunny Wash, Sunrise, Sunshine, Sweet Time, Sweetblood, Sweets, Sweetskin, Sweetwater, Swift, Swindler Irongut, T-Bone, Tabs, Taco, Takecharge, Tall Boy, Tango, Tenderfoot, Tev, The Duke, The Legs, The Pineapple Boy, The Way, Tiga, Time, Tingles, Tip Toe, Tippytop, Tit Punch, Tko, Toddler Snacks, Tomahawk, Toots Magee, Toph, Tortoise, Tough, Tour Guide, Trailhead, Trailmaster, Travelinbeat, Treadmill, Tri-Tip, Trip Hazard, Trish, Trudge, Truffle, Tubs, Tumbleweed, Twinkle Toes, Twist, Twocan, Ultra, Uncle Clint, Undercover, Upah, Venom, Vista, Vortex, Vortex The One Hit Wonder, Vulture, Waldo, Waluigi, Warbler, Water Taxi, Whiskey, Whispers, Whistler, Whitebeard, Whiz, Wiki, Wildfire, Wind, Wing-It, Wit, Wizard, Woodsy, Woody, Workshop, Worthy, Wrongway, Yawp, Yeehaw, Yellow Pages, Yellowjacket, Yelnats, Yeti, York, Zinger, Zip Tie, Zipfy, Zipline, Zippy, and Zookeeper.
If you have any feedback, comments, suggestions to improve the survey, or data you would like to see in future posts or surveys, leave a comment below and let me know!
Sign Up for Next Year’s Survey
Pacific Crest Trail Survey Collection
Affiliate Disclosure: This page may contain affiliate links, which means I may receive small commissions for purchases made via these links at no additional cost to you. This helps pay the bills and keep the site up and running. Thank you for your support!